Table extraction uses machine learning models to automatically convert tables embedded in files (e.g. PDFs, PNGs), into digital formats (e.g. Excel, CSVs).
I designed this feature while working at Impira, between 2021 to 2022, along a core team of front-end developers, the head of machine learning, our head of product, and the CEO.
Impira was a start-up based in San Francisco, building a product to help people automatically extract information from their files. Before I'd joined the company, Impira had sold mostly to large businesses, often flying to on-site sales calls. After the pandemic, they pivoted their business model to sell directly to customers via their website, and found some initial traction with smaller companies.
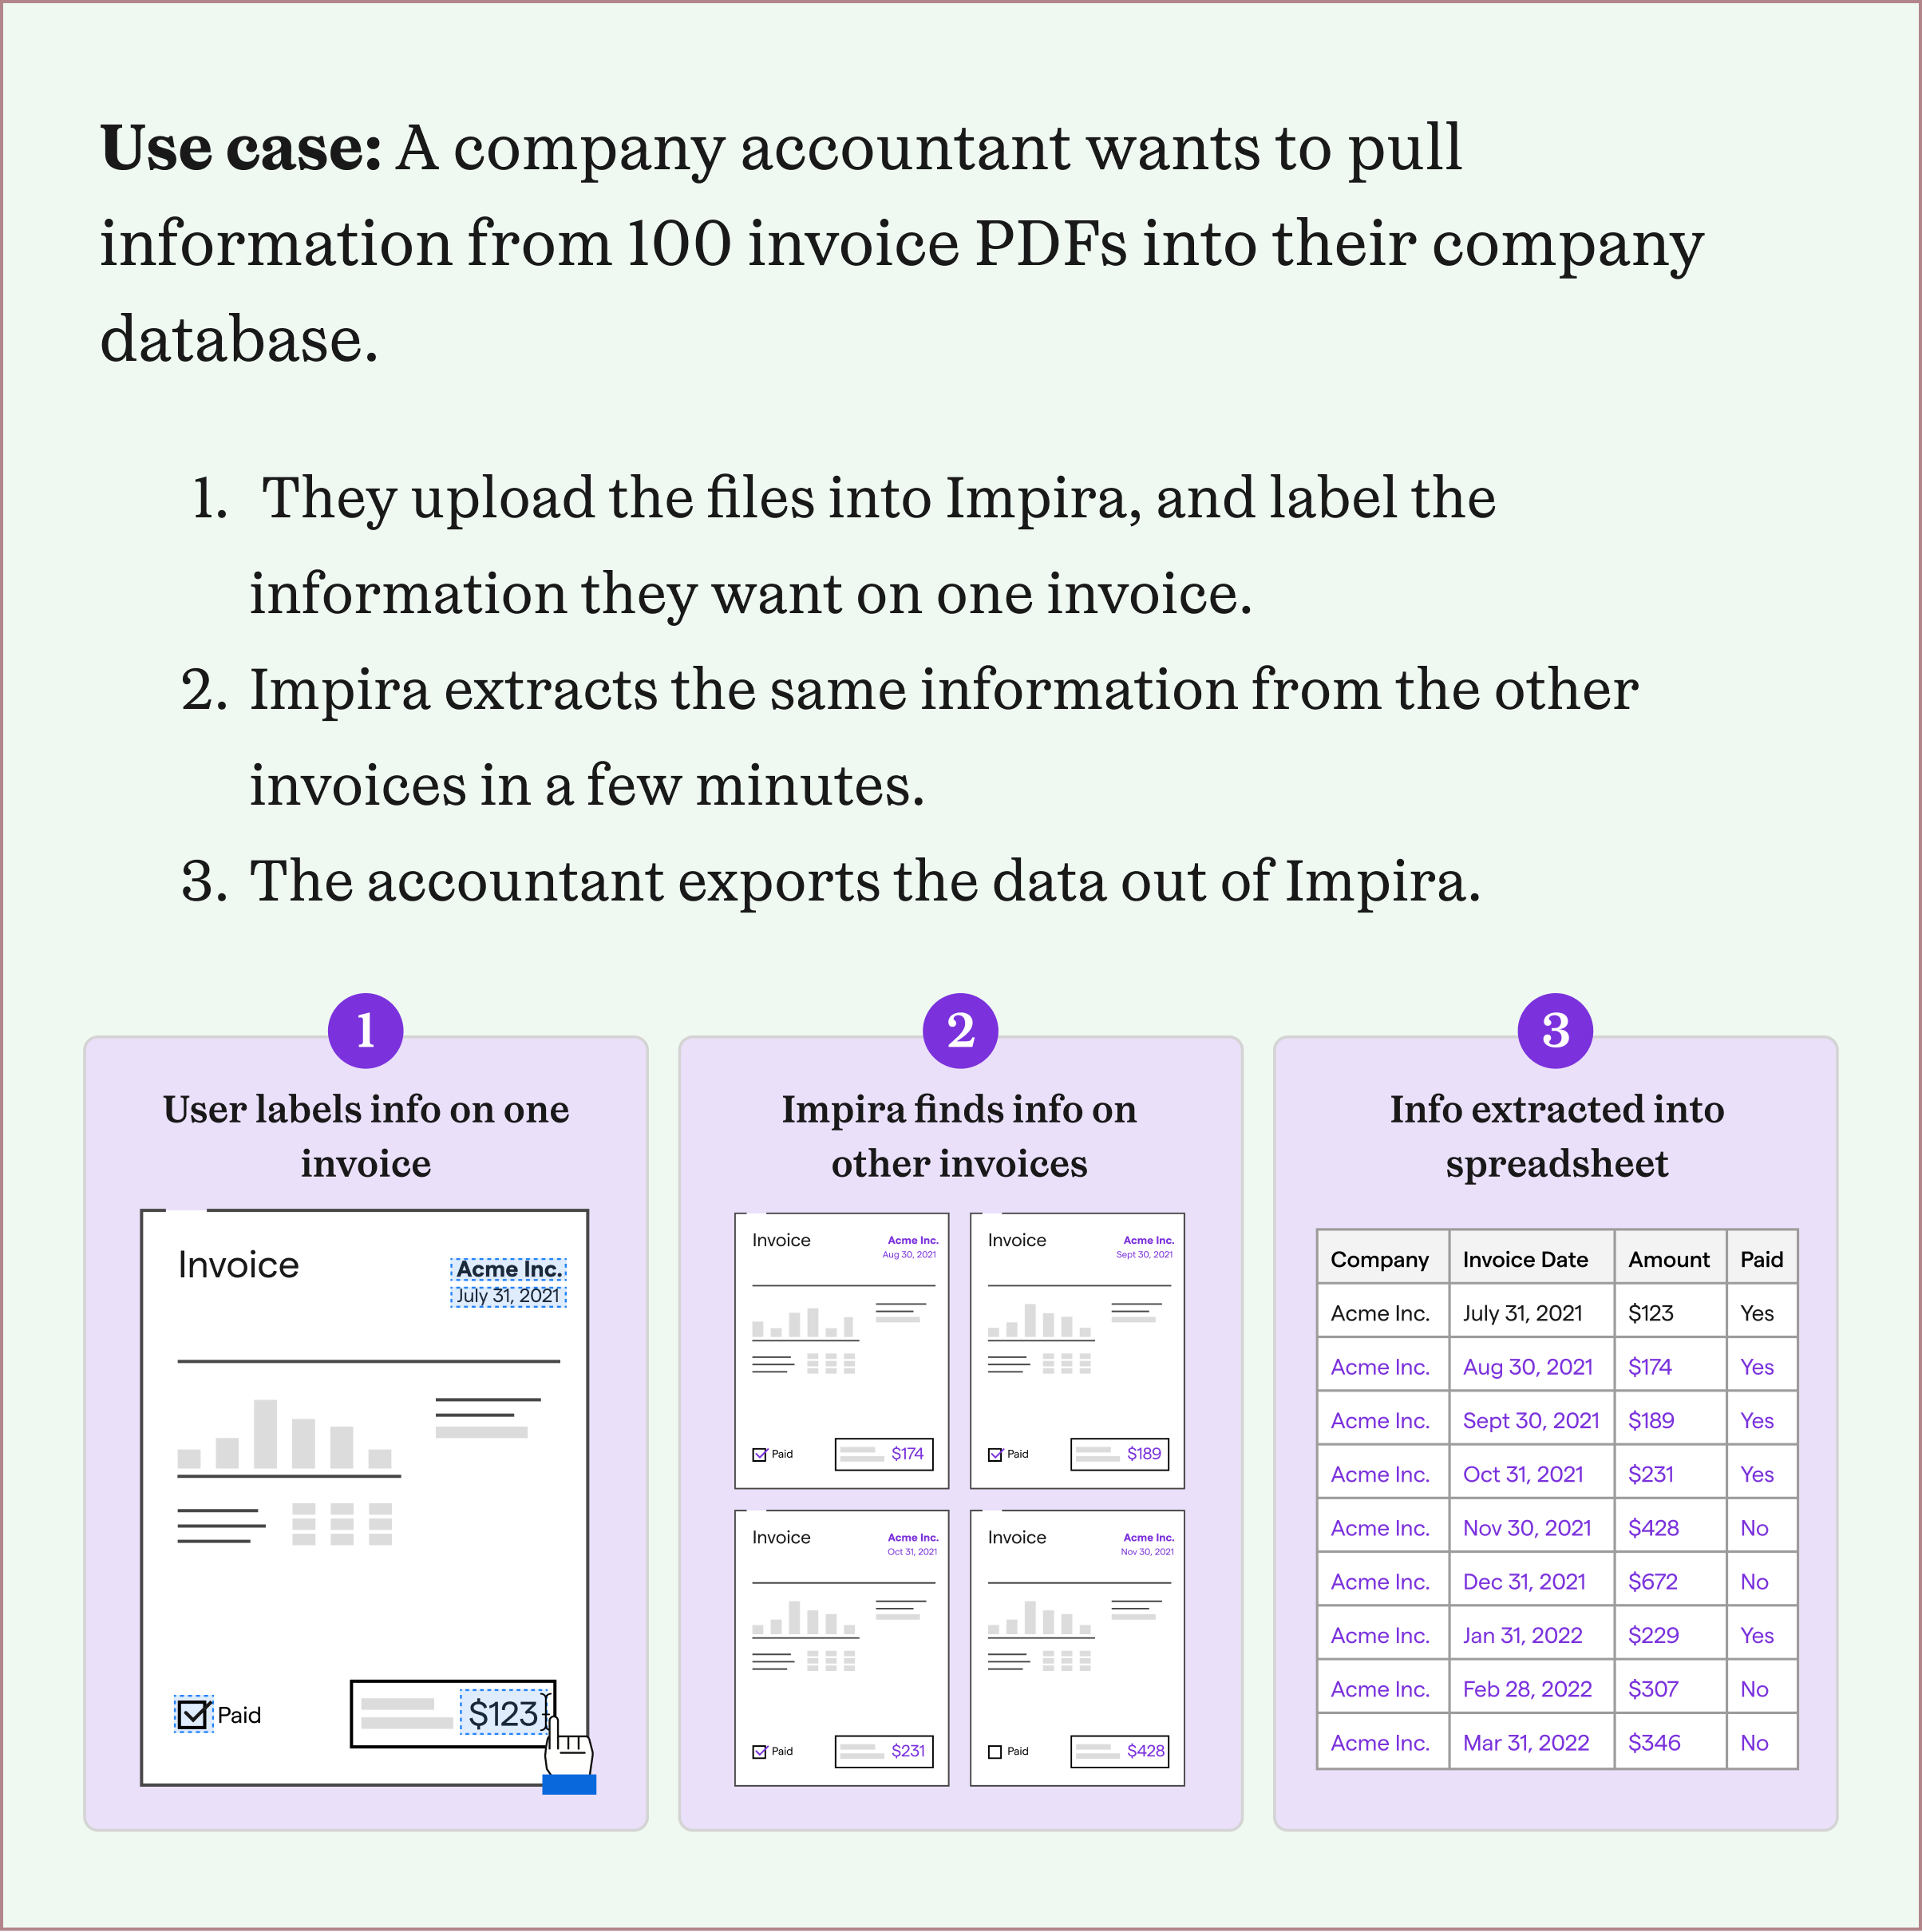
When I joined Impira, the company was working towards product-market fit, and and we were iterating on a newly launched product to expand beyond an initial group of users. As we investigated the files that users were uploading and the information they wanted to extract, we found that most users signing up for our product were trying to extract tables of information.
However, table extraction required more sophisticated machine learning models that we hadn't developed yet, and a more complicated user experience to label and view extracted tables. To better support most users coming into our product, we created a small team to develop table extraction: the head of machine learning, a product manager, a front-end developer, and me.
From watching recorded customer support calls and videos of onboarding users, I had a rough idea of the types of tables users wanted to extract. Especially given that Impira was in the early stages of its product development, I wanted to better understand why users preferred our solution over competitors', and if there was a pattern between these users.
To do so, I worked with my product manager and Impira's CEO to identify a few power users to talk to, all of whom were hoping to use our table extraction product. Using the "jobs-to-be-done" framework, I created a research interview guide around: how these users found Impira, what other document extraction products they'd tried, why they chose Impira, and a walk-through of the workflow they needed table extraction for. I also invited my product manager and front-end developer to join each interview so that we’d have the same user understanding.
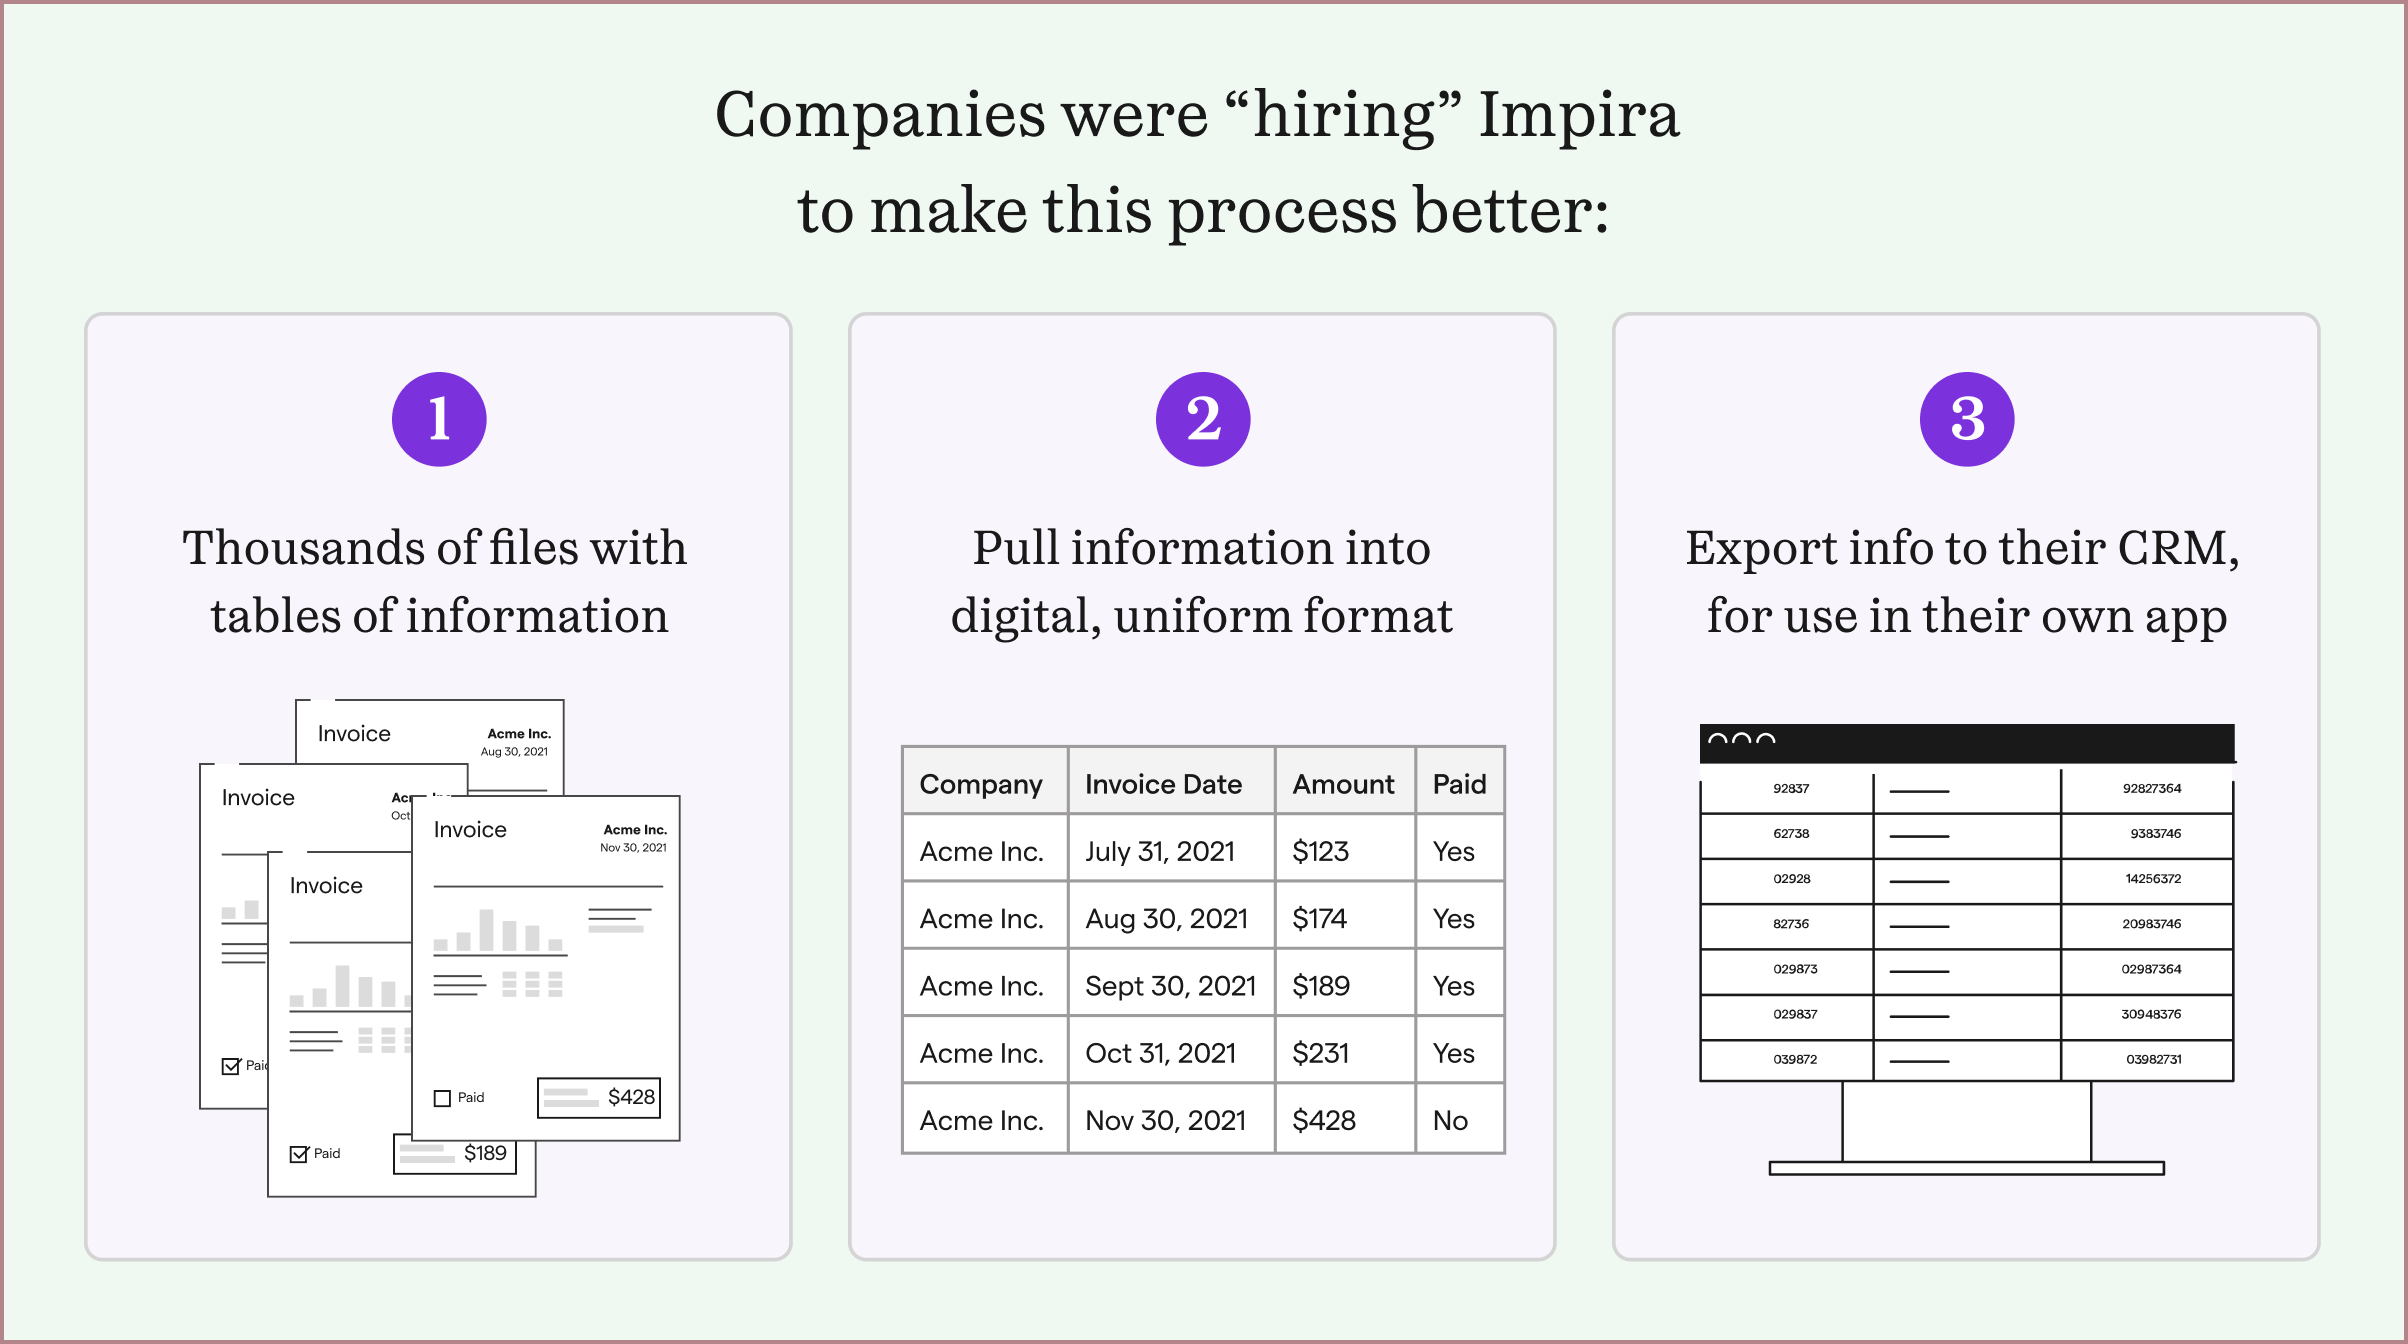
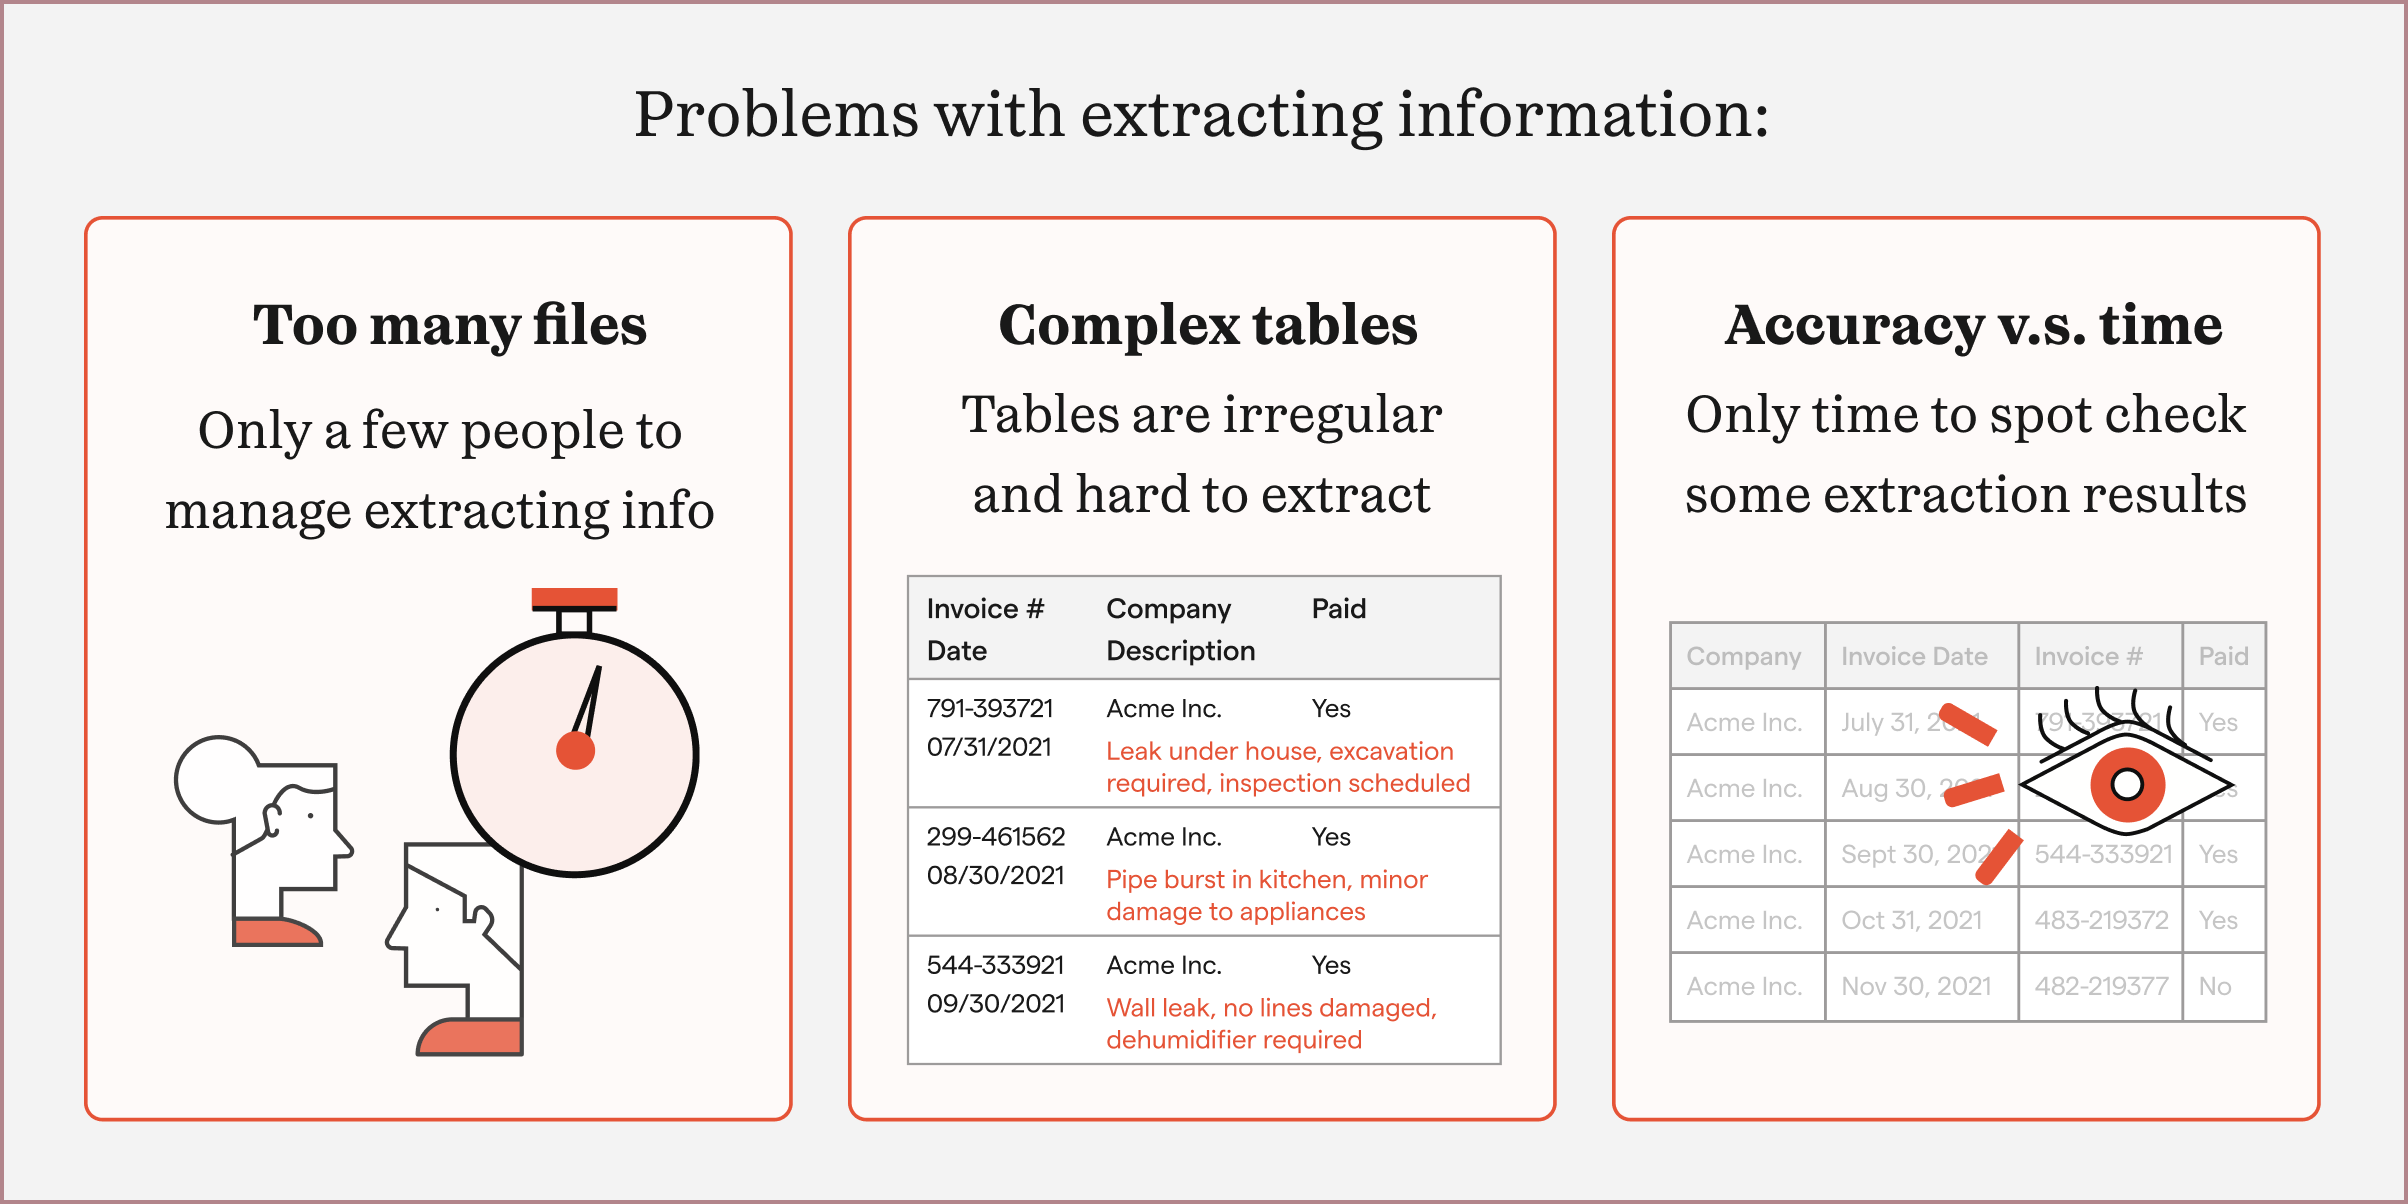
Every company I interviewed had thousands of files that had similar information, but different layouts, that needed to be inputted into the company's own CRM. Their diverse but centralized information sources were key to their business use cases. The people in charge of inputting the information so often had other responsibilities they needed to complete, and were overwhelmed with the number of files they had to manually input. And although these companies catered to different industry domains (e.g. food orders, shipping orders, etc.), the overall workflow they needed help with was similar.
Each of these companies had tried multiple extraction software solutions, but could not find one that could solve their problems. They found that most extraction softwares either pre-trained their solutions to work on specific layouts, or tried to use geometric locations on a file to detect its information. One or two solutions they tried could train on files, but needed hundreds of files of each layout type, and were slow and expensive.
In contrast, Impira's solution could extract fields of information on different layout types with just one first example. These companies just needed Impira to do so across tables, instead of single fields.
Because these pain points were so important to their business processes, they were willing to test out a beta product and provide feedback. To keep close to user feedback, I scheduled regular calls with these groups to share my developing table extraction designs.
Internally, we delved more into different table formats. After looking at tens of examples, we differentiated them into two main types: simple tables or complex tables.
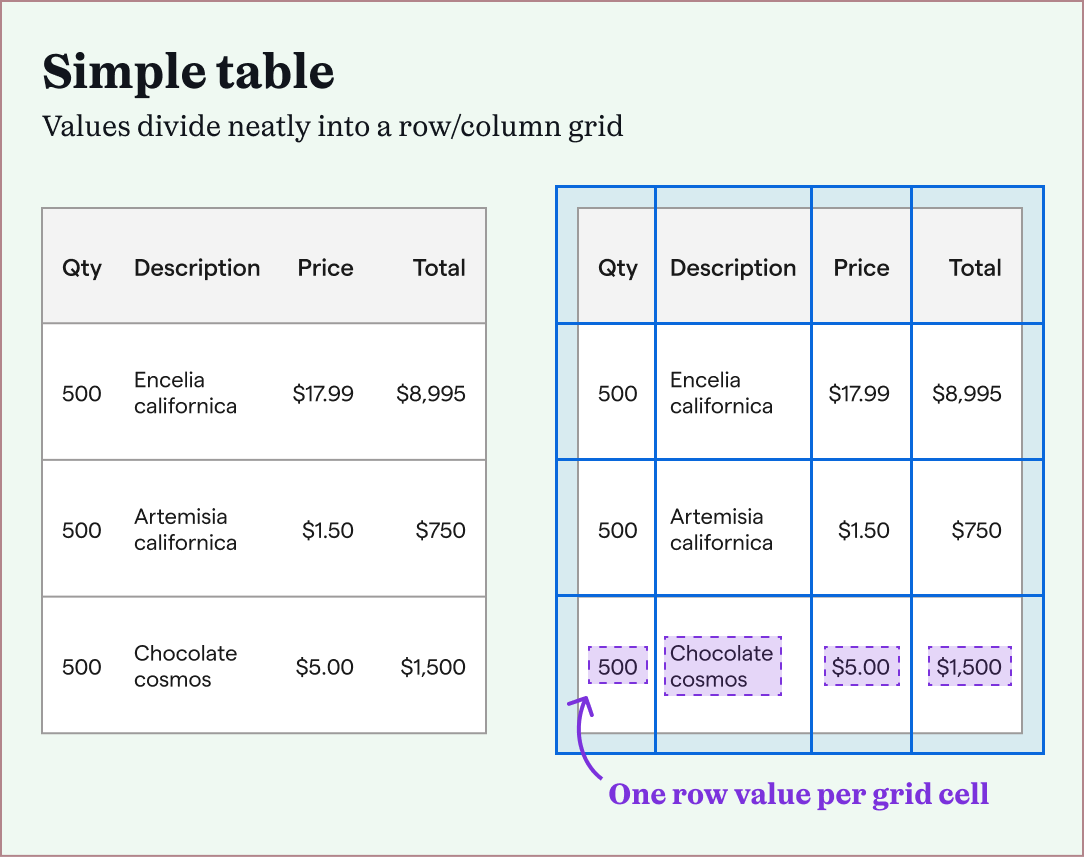
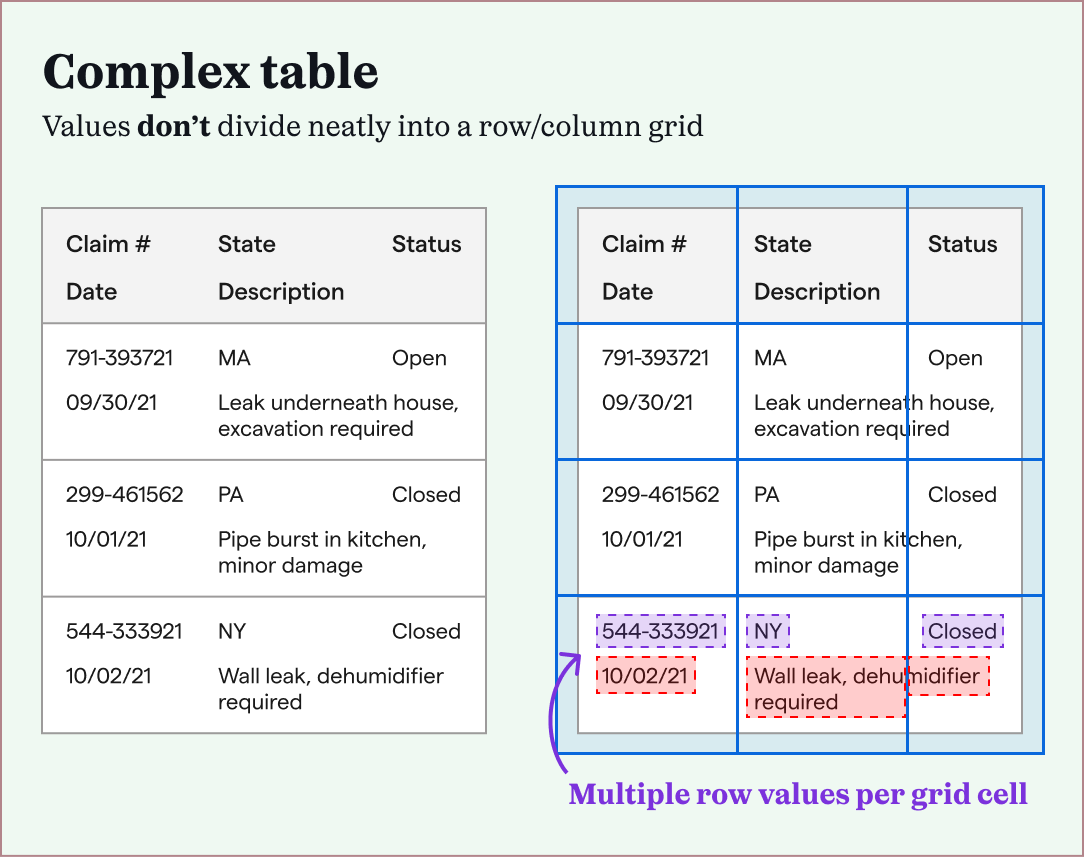
Simple tables were easier to extract, because of their consistent structures. After defining the table's overall boundary, and its row and column dividers, each grid cell contained a single table value. This didn't work with complex tables, which meant that machine learning models had to learn the "shape" of each complex table to extract it correctly.
We found that most of our power users had complex tables they needed to extract. Since Impira's machine learning models already trained themselves on files, they could be developed further to train on complex tables.
While our head of machine was building out machine learning models to extract these two types of tables, I researched our competitors how they dealt with simple and complex tables.
Across the board, I found that no solutions could extract complex tables accurately, but also that most solutions extracted simple tables immediately.
After uploading a file with a table, each solution either attempted to extract the table immediately, asked the user to highlight only the table's boundaries, or at most asked the user to specify where the table's borders, row dividers, and column dividers were. (This therefore only worked to extract simple tables.)
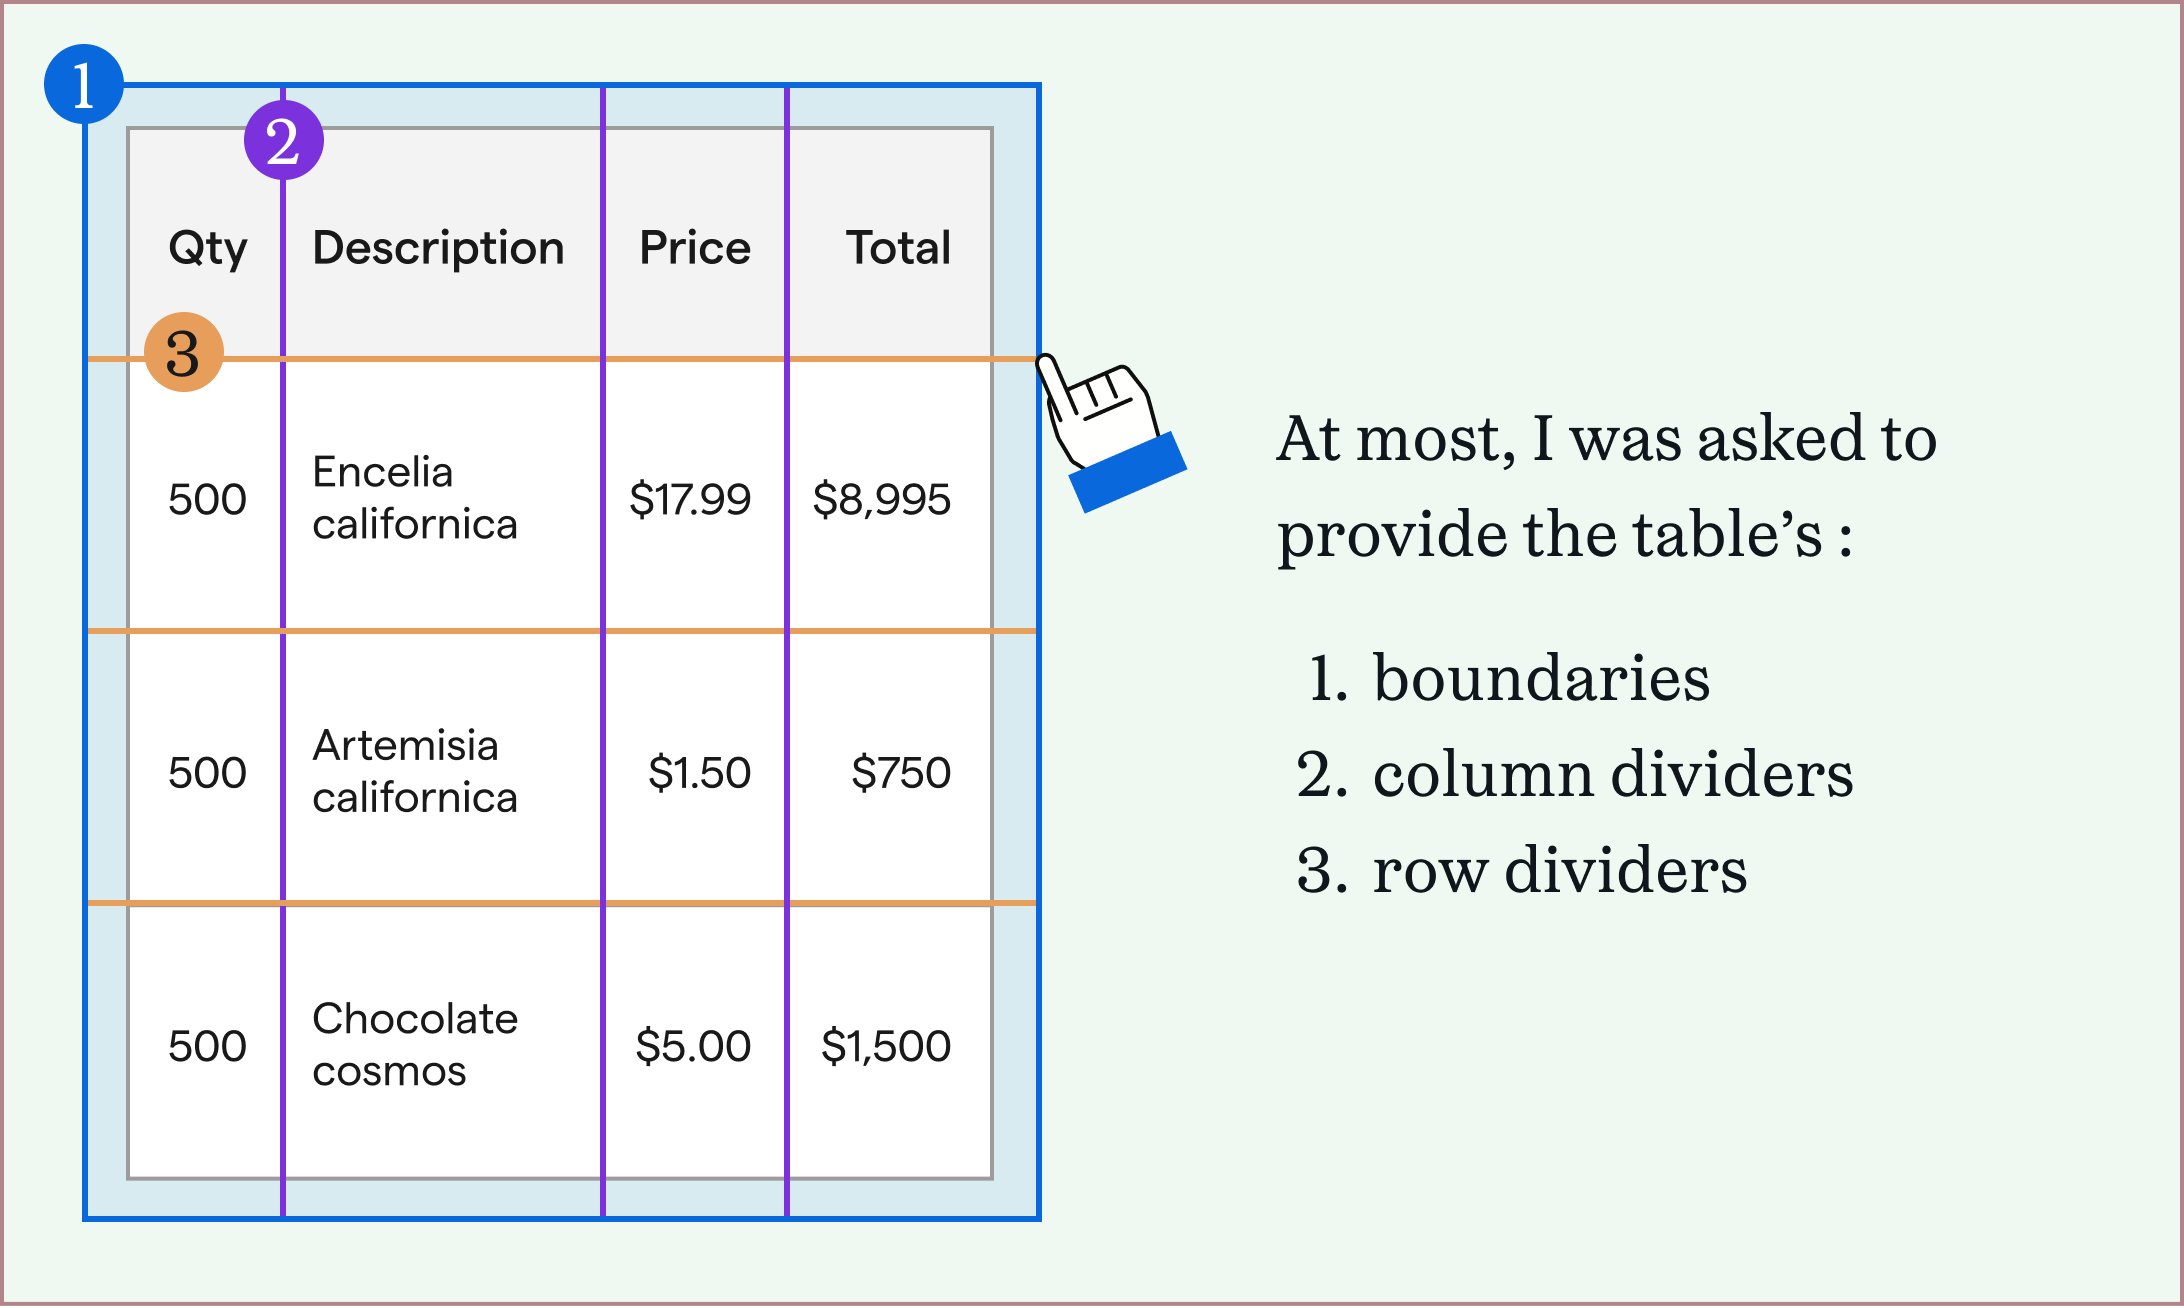
Only one of the solutions specified that they could train to a user's files, but they asked for at least 30 files to train on, and did not provide accurate results. Lastly, none of the solutions was able to improve their extraction results based on corrections I provided.
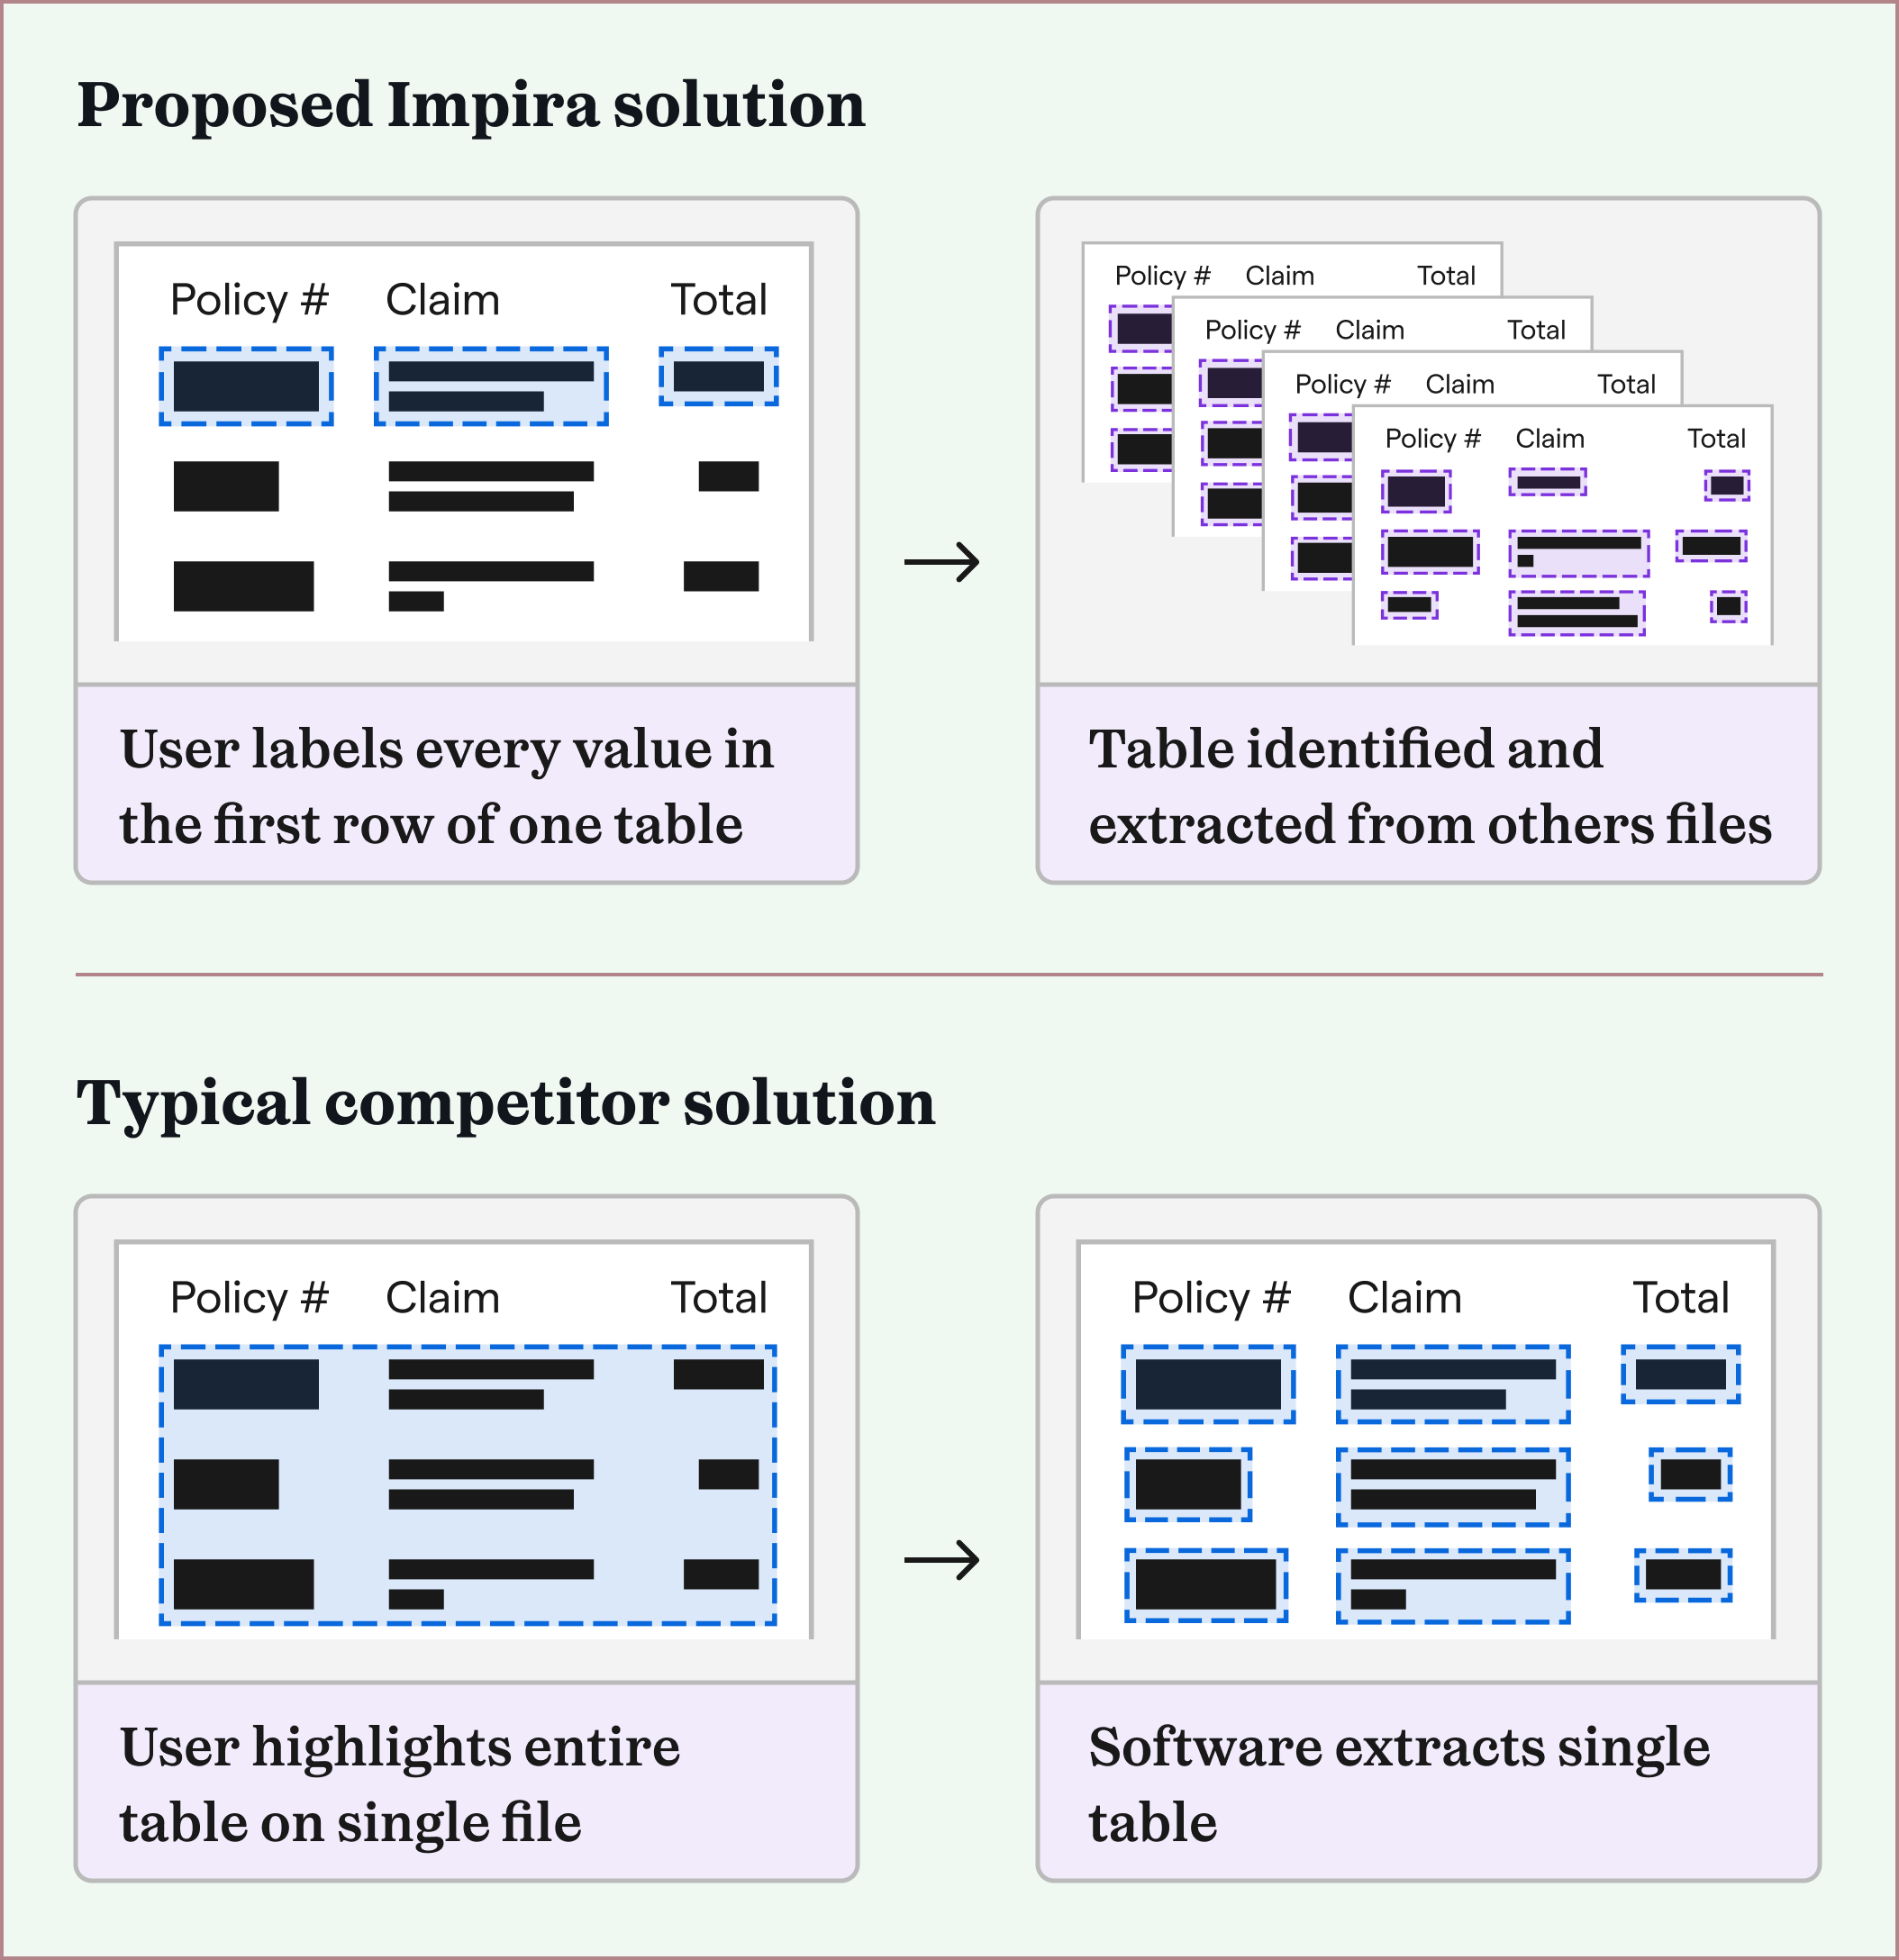
Throughout this process, our table extraction team had weekly progress check-ins. Impira's head of machine learning let me know that he expected the table extraction models to require users to label every value in the first row of a table, on a single file in order to accurately extract complex tables. This meant our extraction process would require more up front set up work than our competitors, which might be a hurdle for new users to Impira.
I expected that most people would try to use Impira's product to extract tables (which we didn't yet support) by either highlighting the entire table, rows, or columns like our competitors' asked. If this were true, I could design using a common mental model in order to help users learn how to extract tables in Impira.
To confirm this hypothesis, I watched two weeks of sessions of new users trying to extract tables from their files. (Impira used a session recording tool called Highlight, with sensitive data obscured.)
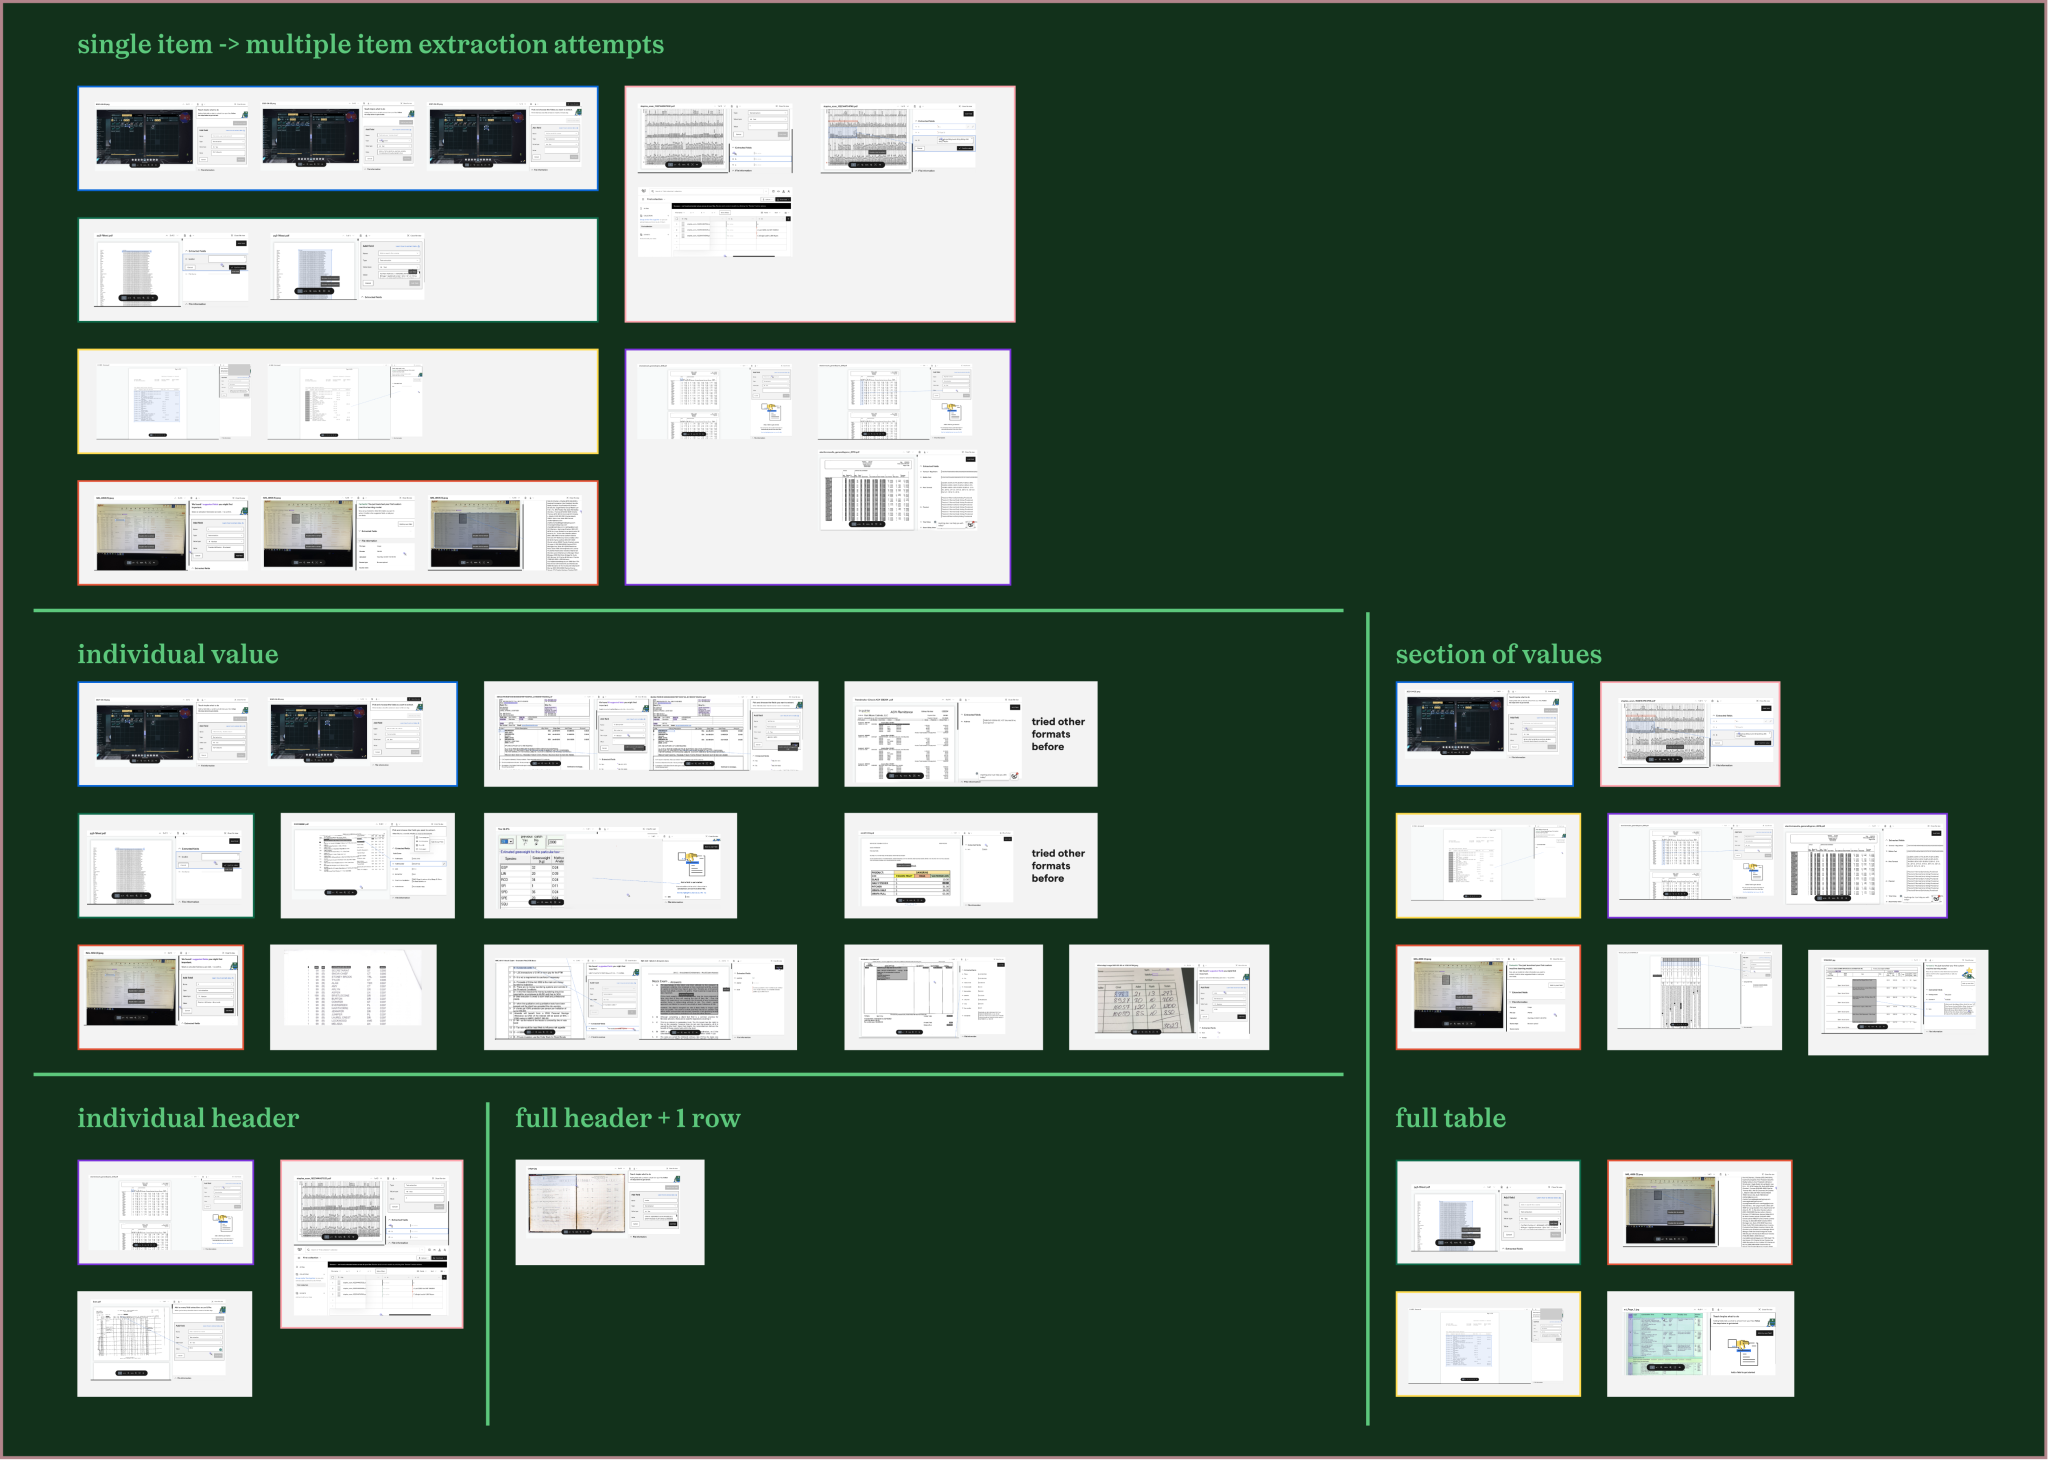
Interestingly, this was not the case—some users attempted to extract tables by selecting individual values in a row, entire rows, or entire columns. There wasn’t a particular interaction pattern across these user sessions that I could use to introduce them to Impira’s extraction set up.
Armed with this information, I started iterating on designs for table extraction. At a minimum, our table extraction experience needed two parts to be designed: how a user could create their table extraction, and how they could view their extracted table information.
Since our head of machine learning was still creating the table extraction models, I started on the second part of the experience.
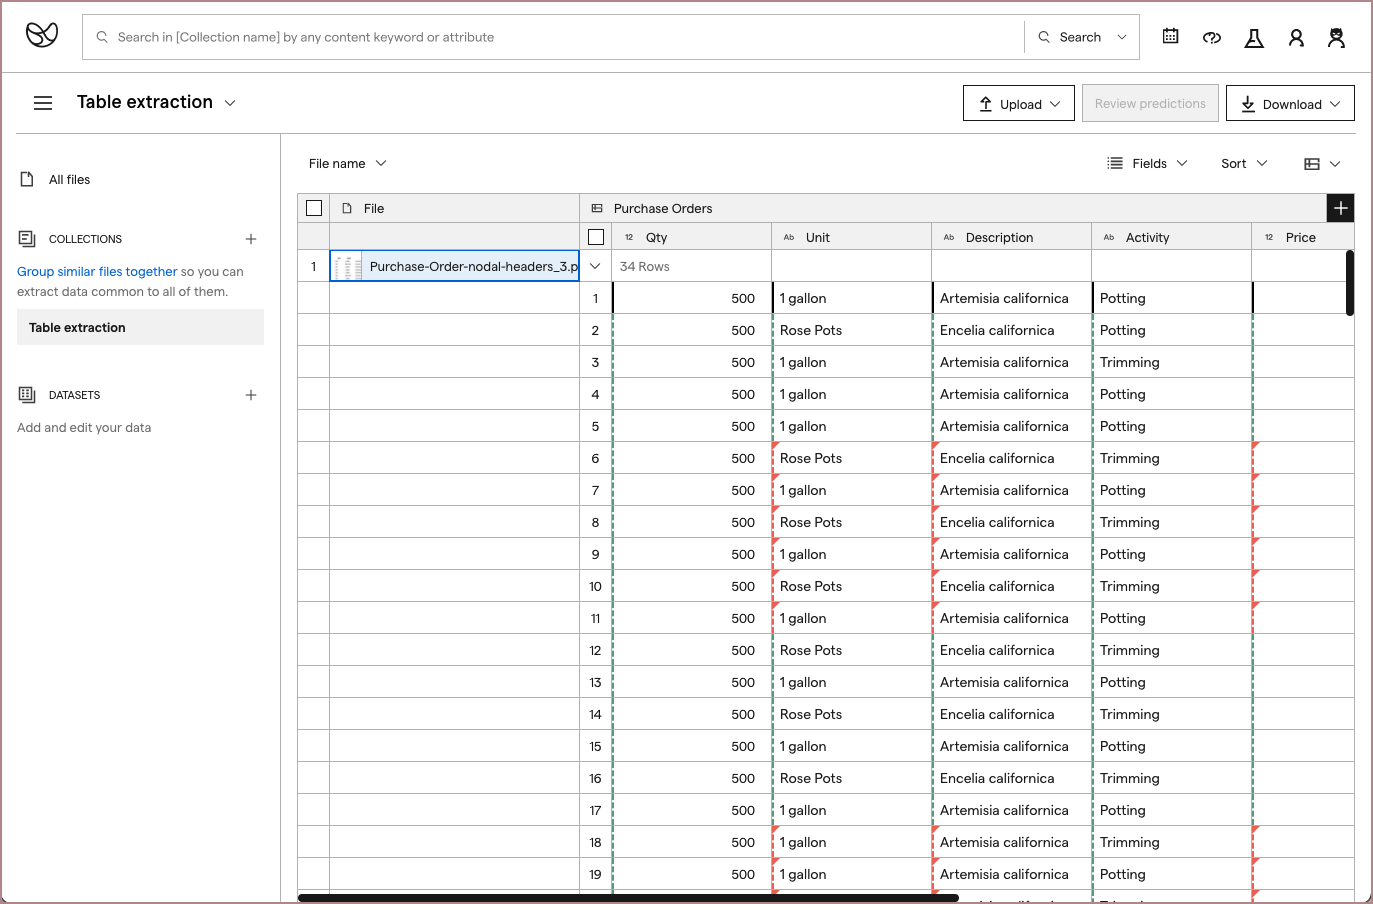
Our product already displayed single fields extracted from files in a spreadsheet like format, and this data could be extracted into different file types (Excel, CSV, JSON). This format was supported by Impira’s own query language (IQL), that allowed excel-like pivots and other formatting.
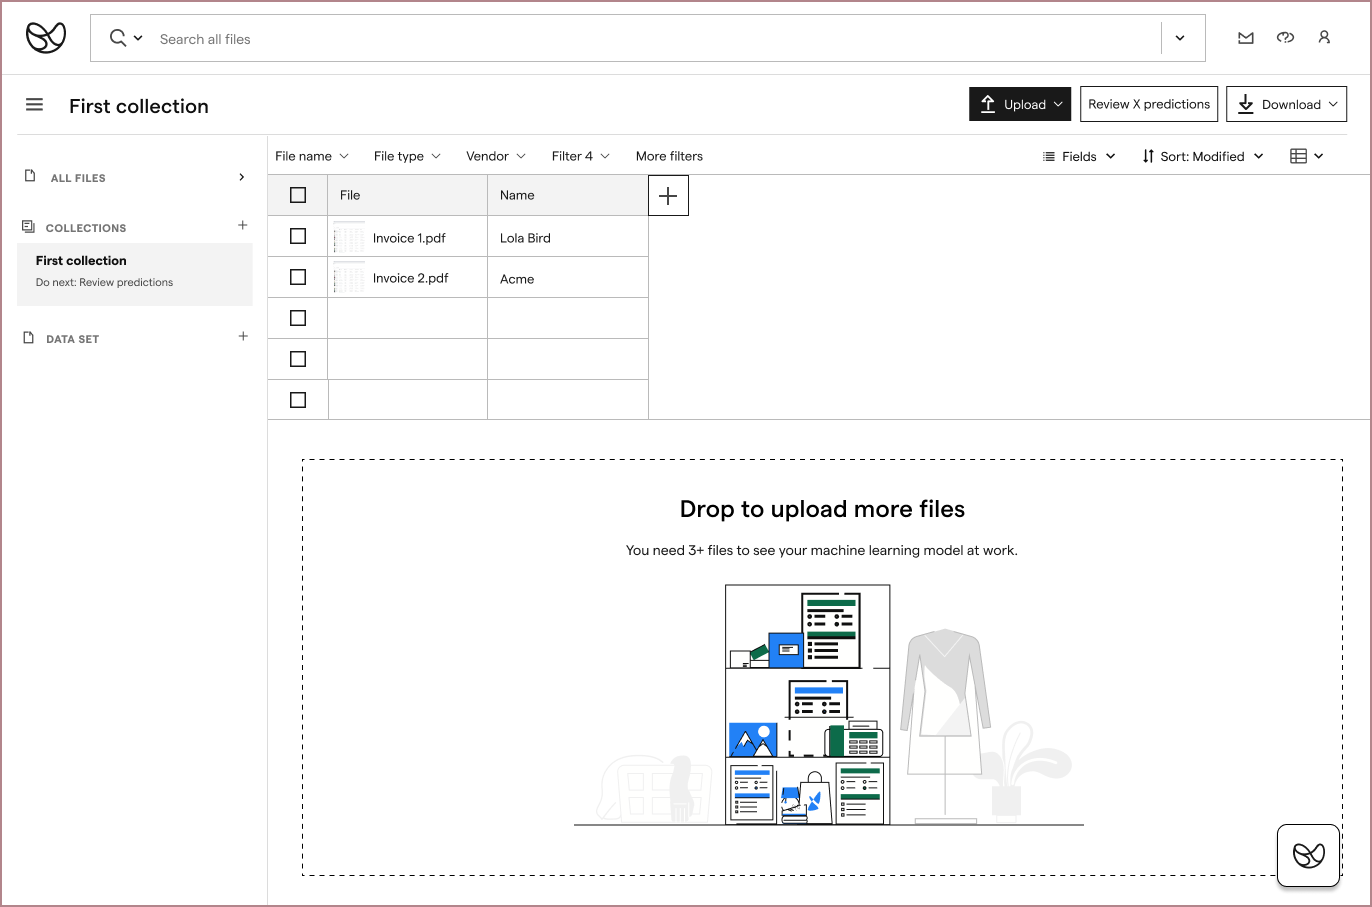
I thought expanding this format to include nested tables would work well with our existing data model, and would work with how users wanted to view their data:
I shared static prototypes of this idea during my user feedback sessions and also confirmed its technical feasibility with my front-end developer teammate and Impira engineering leadership.
The designs were received well; since the navigation was similar to spreadsheets, it was intuitive to understand. Users also confirmed that the display worked well to confirm extraction results per file.
My front-end developer teammate started building out this experience.

We later expanded on the data extraction display functionalities, and submitted a patent for it.
Finally, I started ideating on the table extraction set up experience. At this point, our machine learning models were close to a first working version, but would still need a lot of iteration to improve its performance. However, the head of machine learning was certain that setting up a table extraction would require at least the entire first row of a table to be labeled.
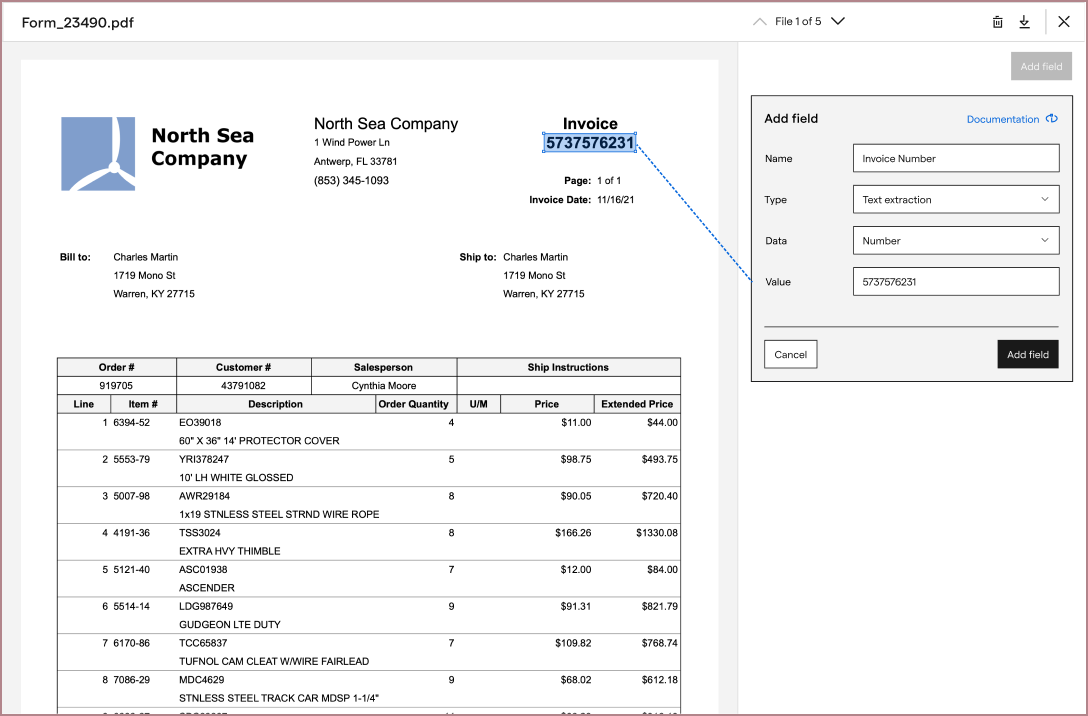
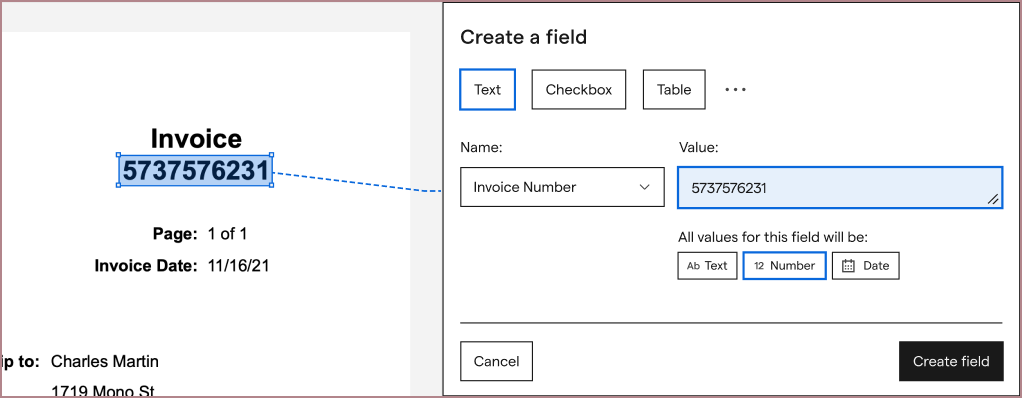
In Impira, to extract a value, a user had to provide: the value's type (e.g. text, number, date), where it was on the page (by highlighting its boundaries), and a name for it (e.g. Invoice amount).
The current labeling interface was too clunky to repeat for a full table row, so I iterated on new versions of it and tested these with UserTesting. From there, I worked with our growth team to A/B test and add this new experience into the product:
From here, I integrated this improved iterface into my table extraction explorations. My first explorations focused around making our table extraction experience entry as simple as competitors. Rather than having users type in every field from scratch, I hoped that we could guess the values from a row highlight, and ask the user to correct and confirm instead:
Along the way, I wanted to provide hints at the user’s results, since our table extraction worked so differently from competitors.
However, between the machine learning models, a new table labeling experience, and data infrastructure changes to support them both that all needed to be developed, we decided to push this exploration until after we had a first version of table extraction released. In addition to having a lot of engineering work to do, we weren’t sure if guessing a user’s rows would be accurate enough. If our guesses were inaccurate, we risked confusing the user and failing to extract any part of the table at all.
Since we couldn't automate the first row configuration yet, users would need to be walked through every step of configuration. This meant they'd have to find the first row on their table, manually draw a box around every value in that row, and provide its column name and data type.
While users needed to see their file during configuration, we couldn't provide a labeling interface on top of users's file because users' tables had too different structures; sometimes they were very long, sometimes they had multiple columns layered on top of each other, and sometimes they were very densely created. So, to help guide users through configuration, my explorations began to settle on a side panel UI layout that could fit next to users' files. To keep the side panel simple, it would walk users through setting up one field at a time. I hoped that this balance would help get Impira the configured values it needed, while not appearing too complicated to users. (Remember, none of our competitors asked their users to configure all of this information.)
While I shared these mocks with the companies I had previously talked to for feedback, I also tested variations of these on UserTesting. This allowed me to get feedback from people who were not familiar with Impira or its existing interface.
During testing variations of this layout, I found that users understood and could successfully label a full table row. However, the interface was not communicating well that users had to label the first row of their table. (Our machine learning models needed to be told where a table started.)
To better communicate this, I tested other iterations that showed machine learning predictions in the table row, on the file rows below, and that added prompts depending on the user's current action. These iterations had varying results when tested, and none of them solved the "first row configuration" problem smoothly.

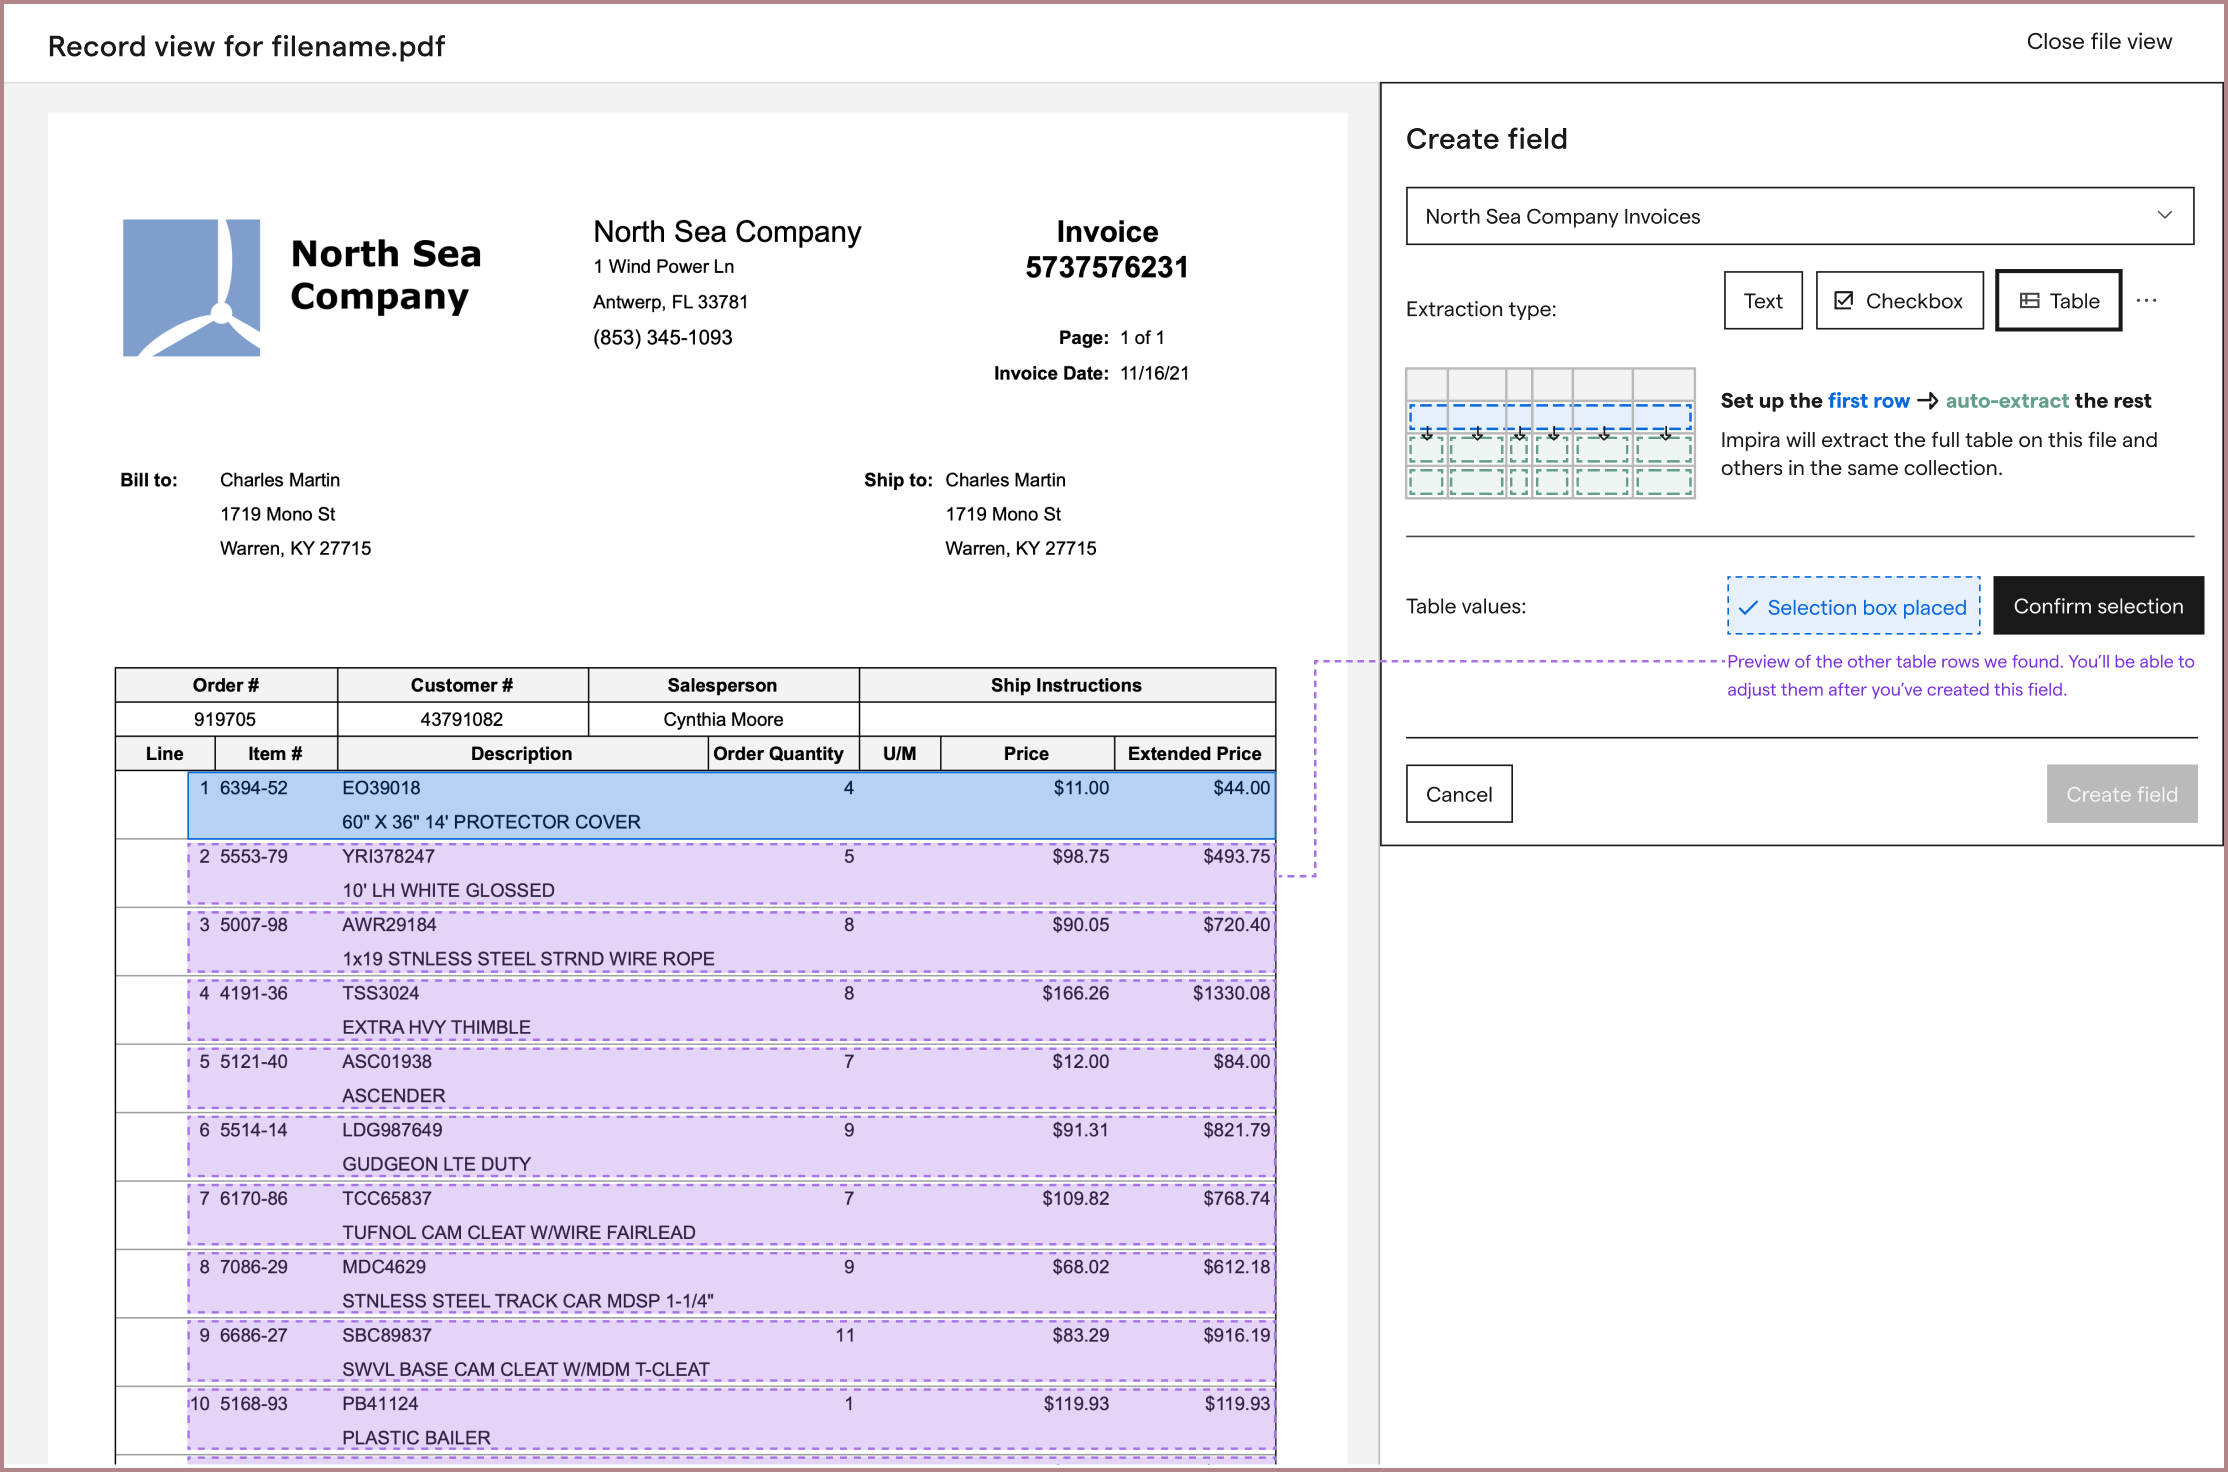
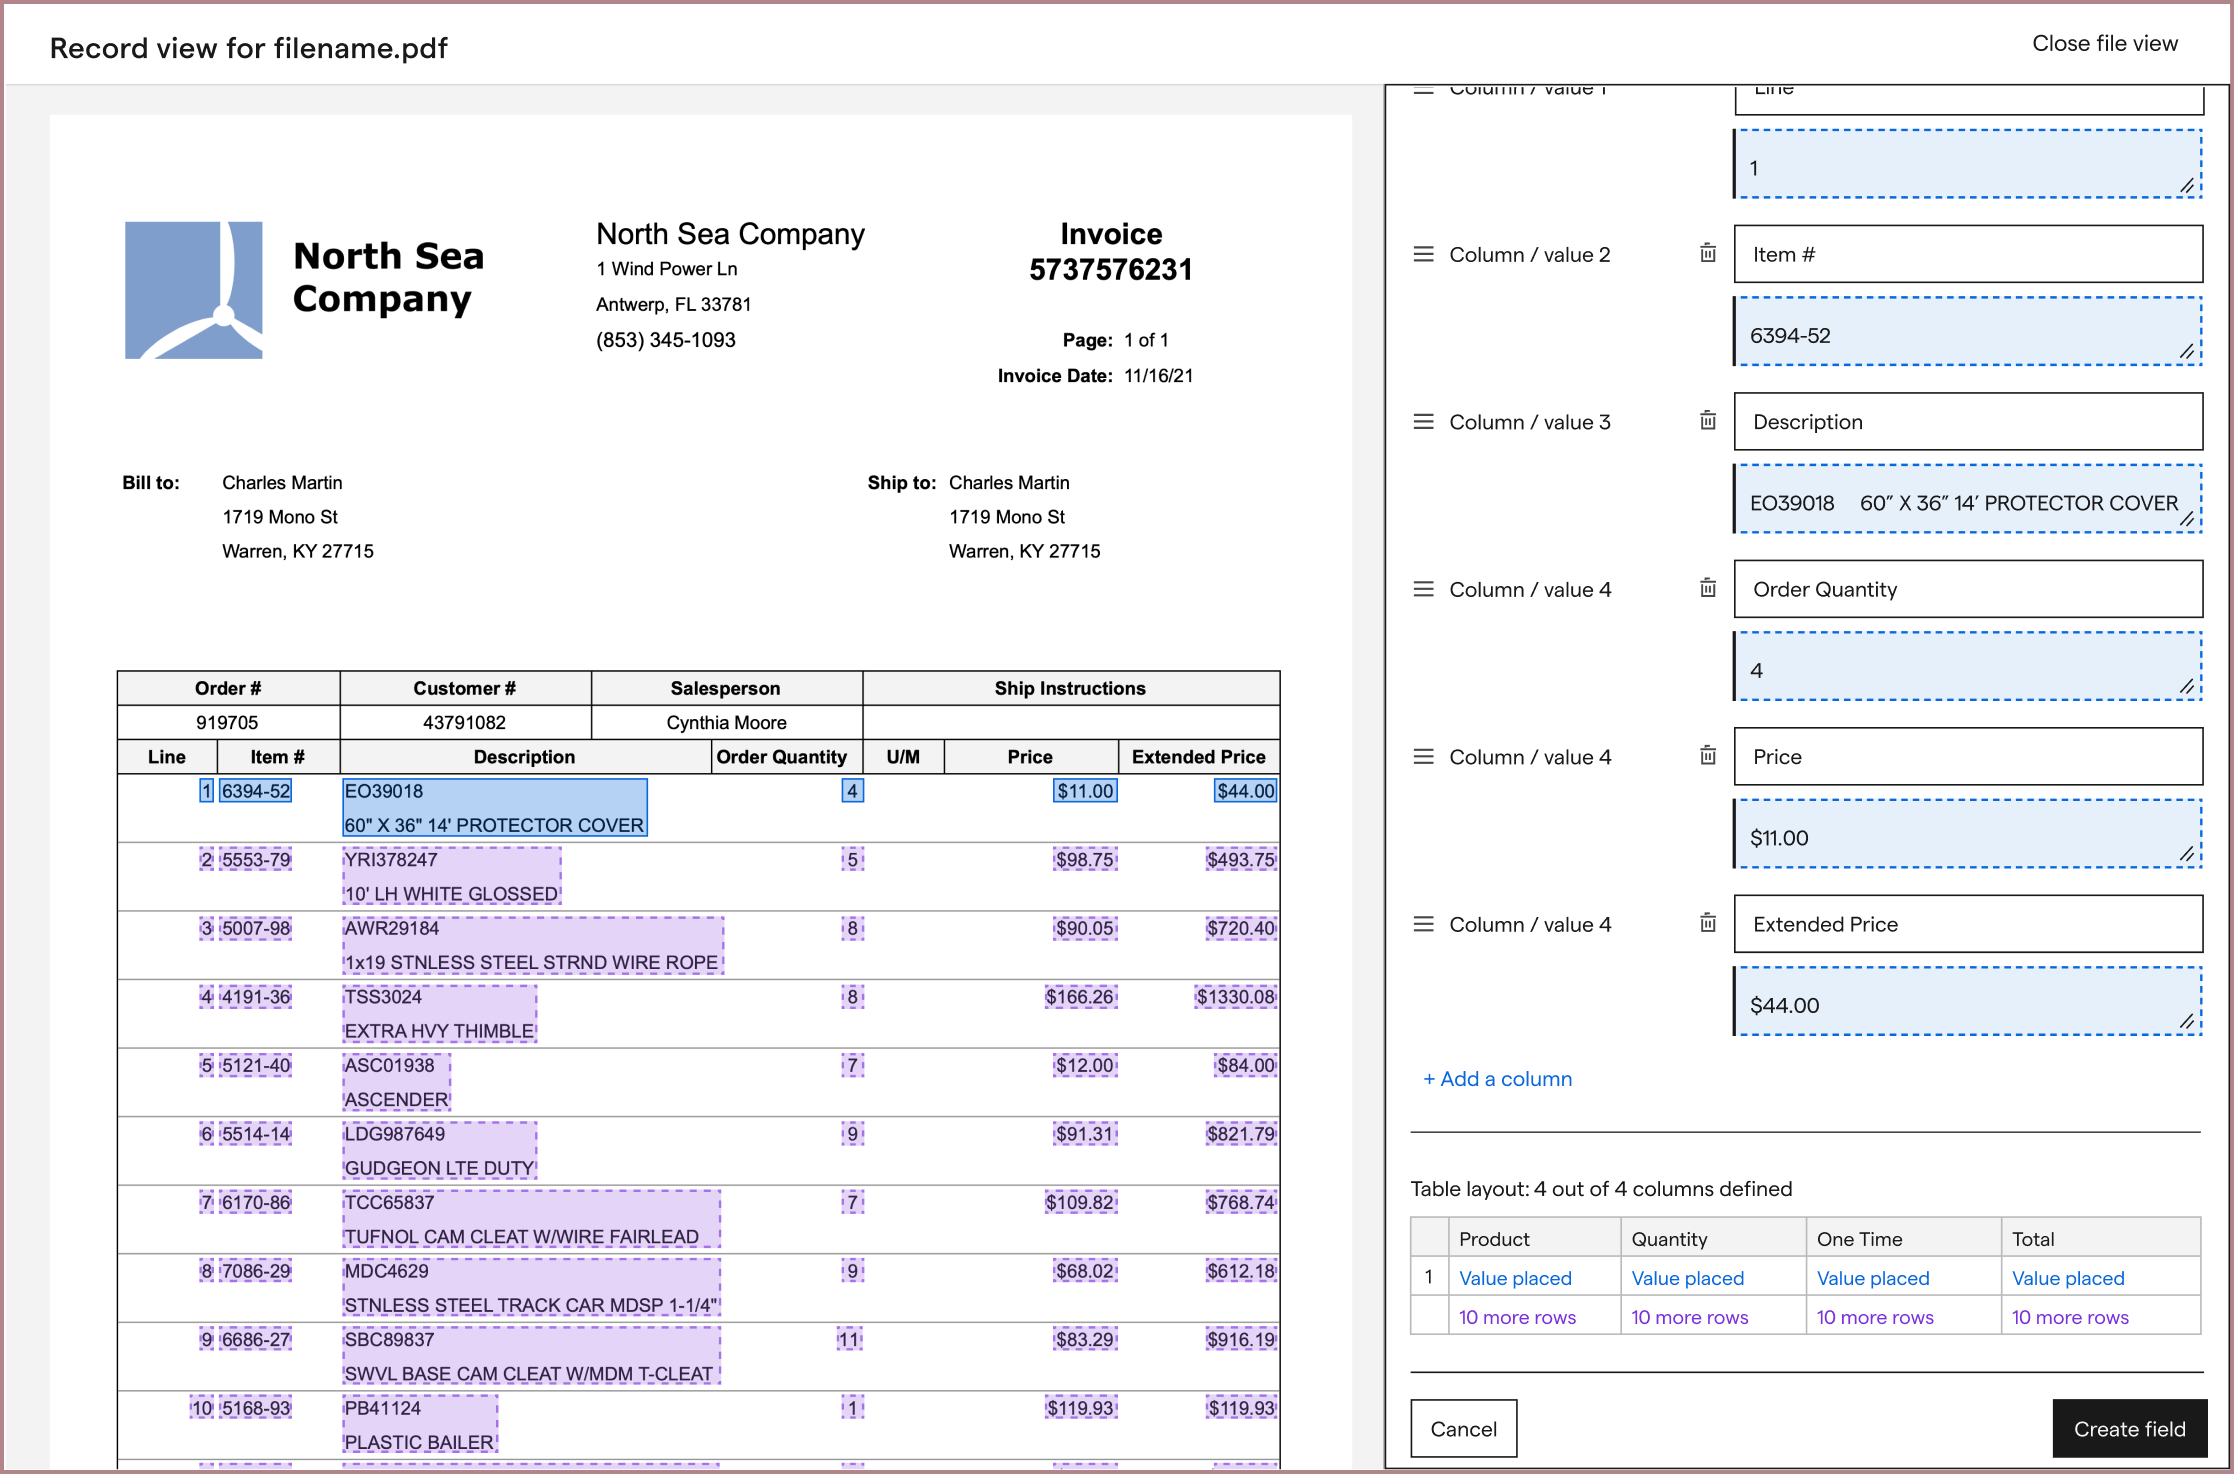
After a few rounds of brainstorming, I tried a different solution: breaking up the complexity of the table extraction configuration. Instead of presenting all of the configuration instructions at once, I split it into two steps: asking the user to highlight their very first table row, then asking them to label each value inside their provided boundary.
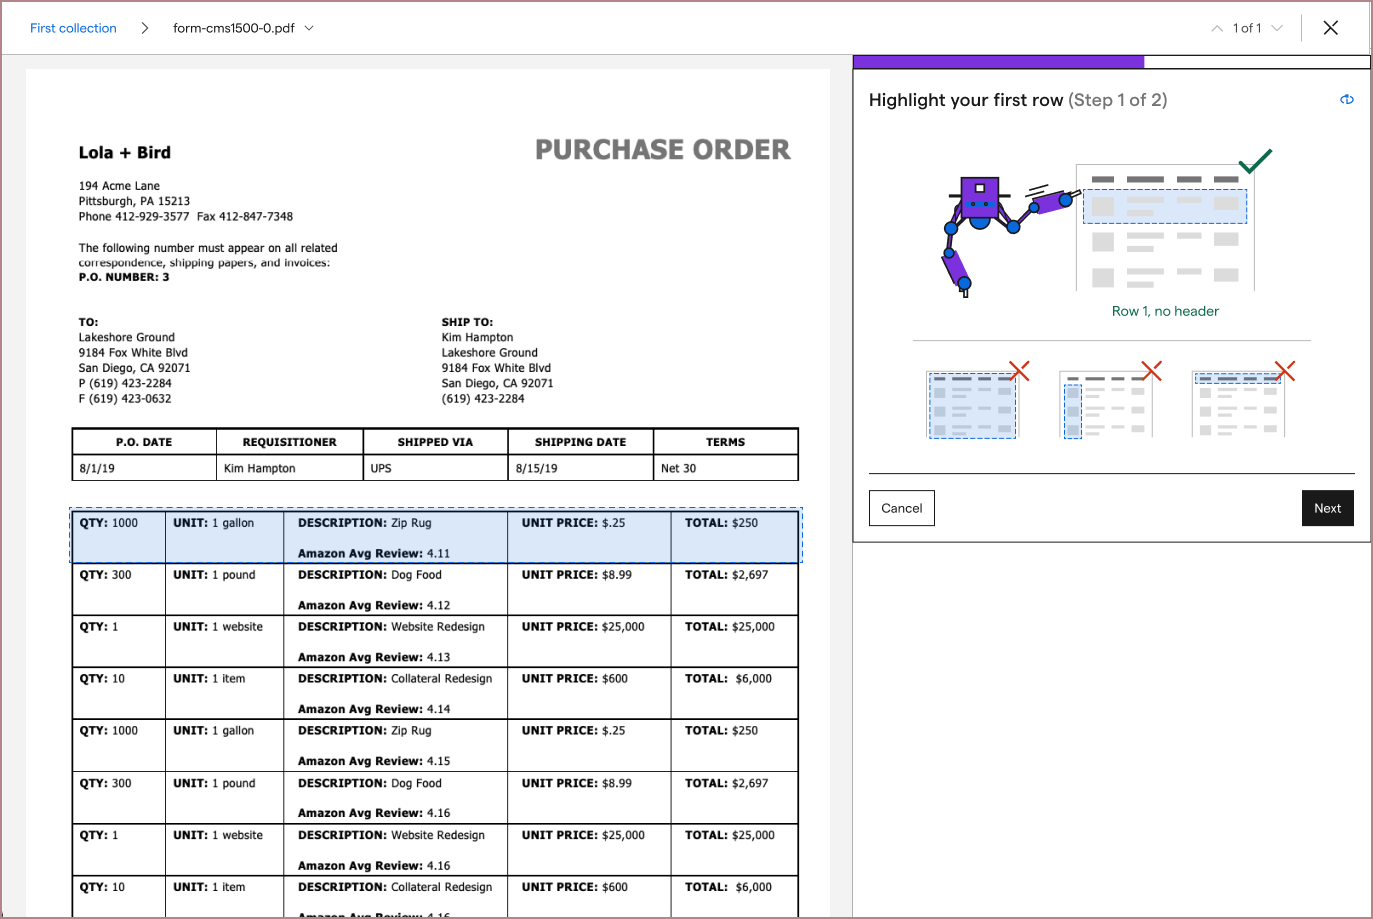
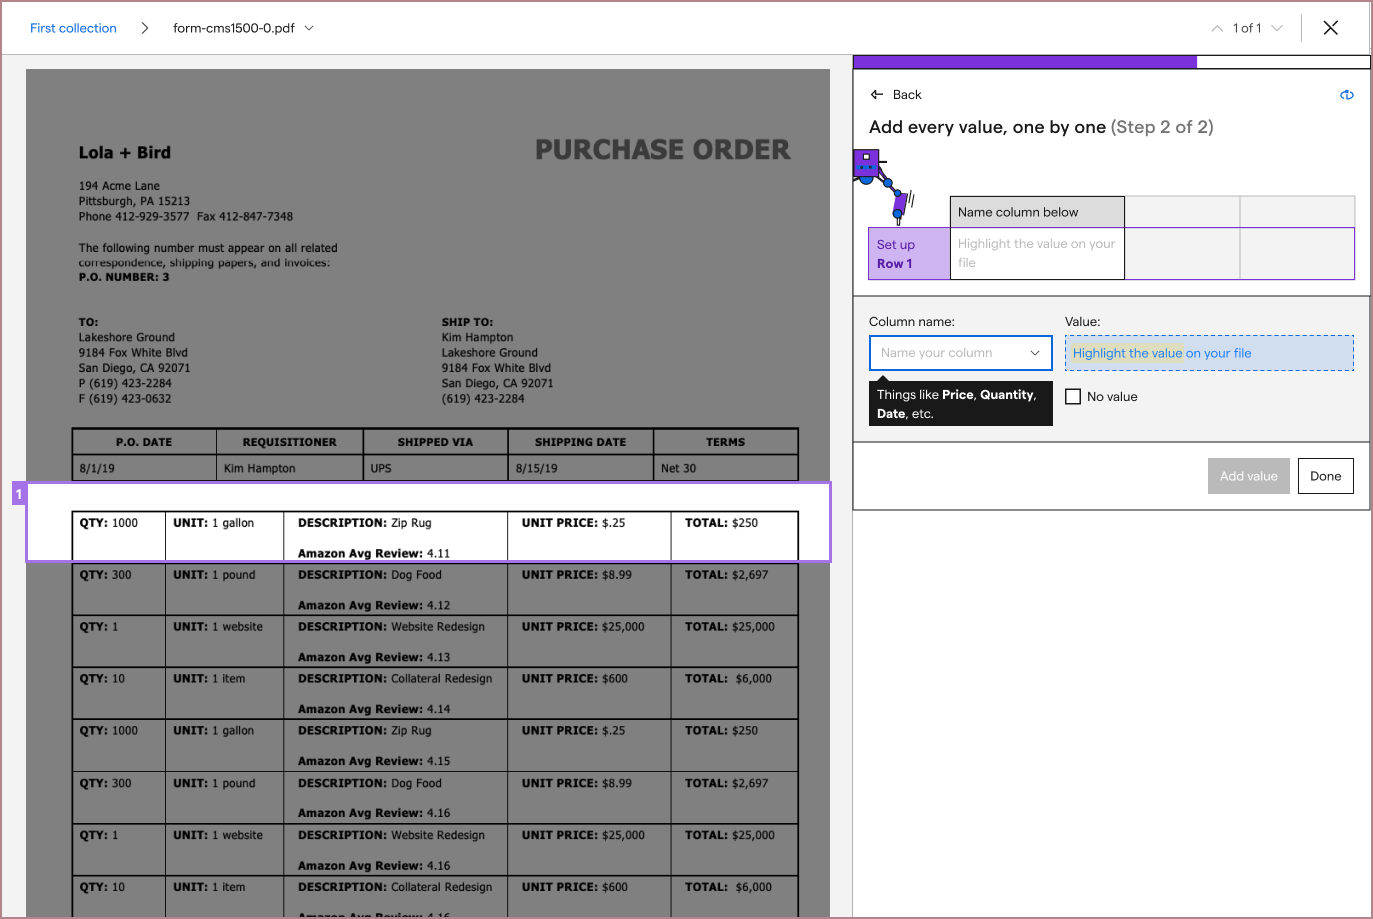
As simple as the solution seemed, it allowed me to provide more imagery defining what the first row of a table was. From here, I started seeing testers much more consistently extracting correct tables.
At this point, I felt that the designs could still be improved, but needed more feedback from users. Since the machine learning models were still being improved, we decided to release a beta version. Via a beta, we could get more information on how the feature could be improved and release a more robust version, after the machine learning models were also stronger.
I worked with a few front-end developers on the team to address edge cases, and fleshed out messaging with our content designer, and we released the beta.

After a few months, during which the head of machine learning continued iterating on model performance and I worked on other projects, we returned to table extraction to improve and release our feature.
I began by watching the past month's sessions of users trying our table extraction experience, and started categorizing the problems I saw users encounter.
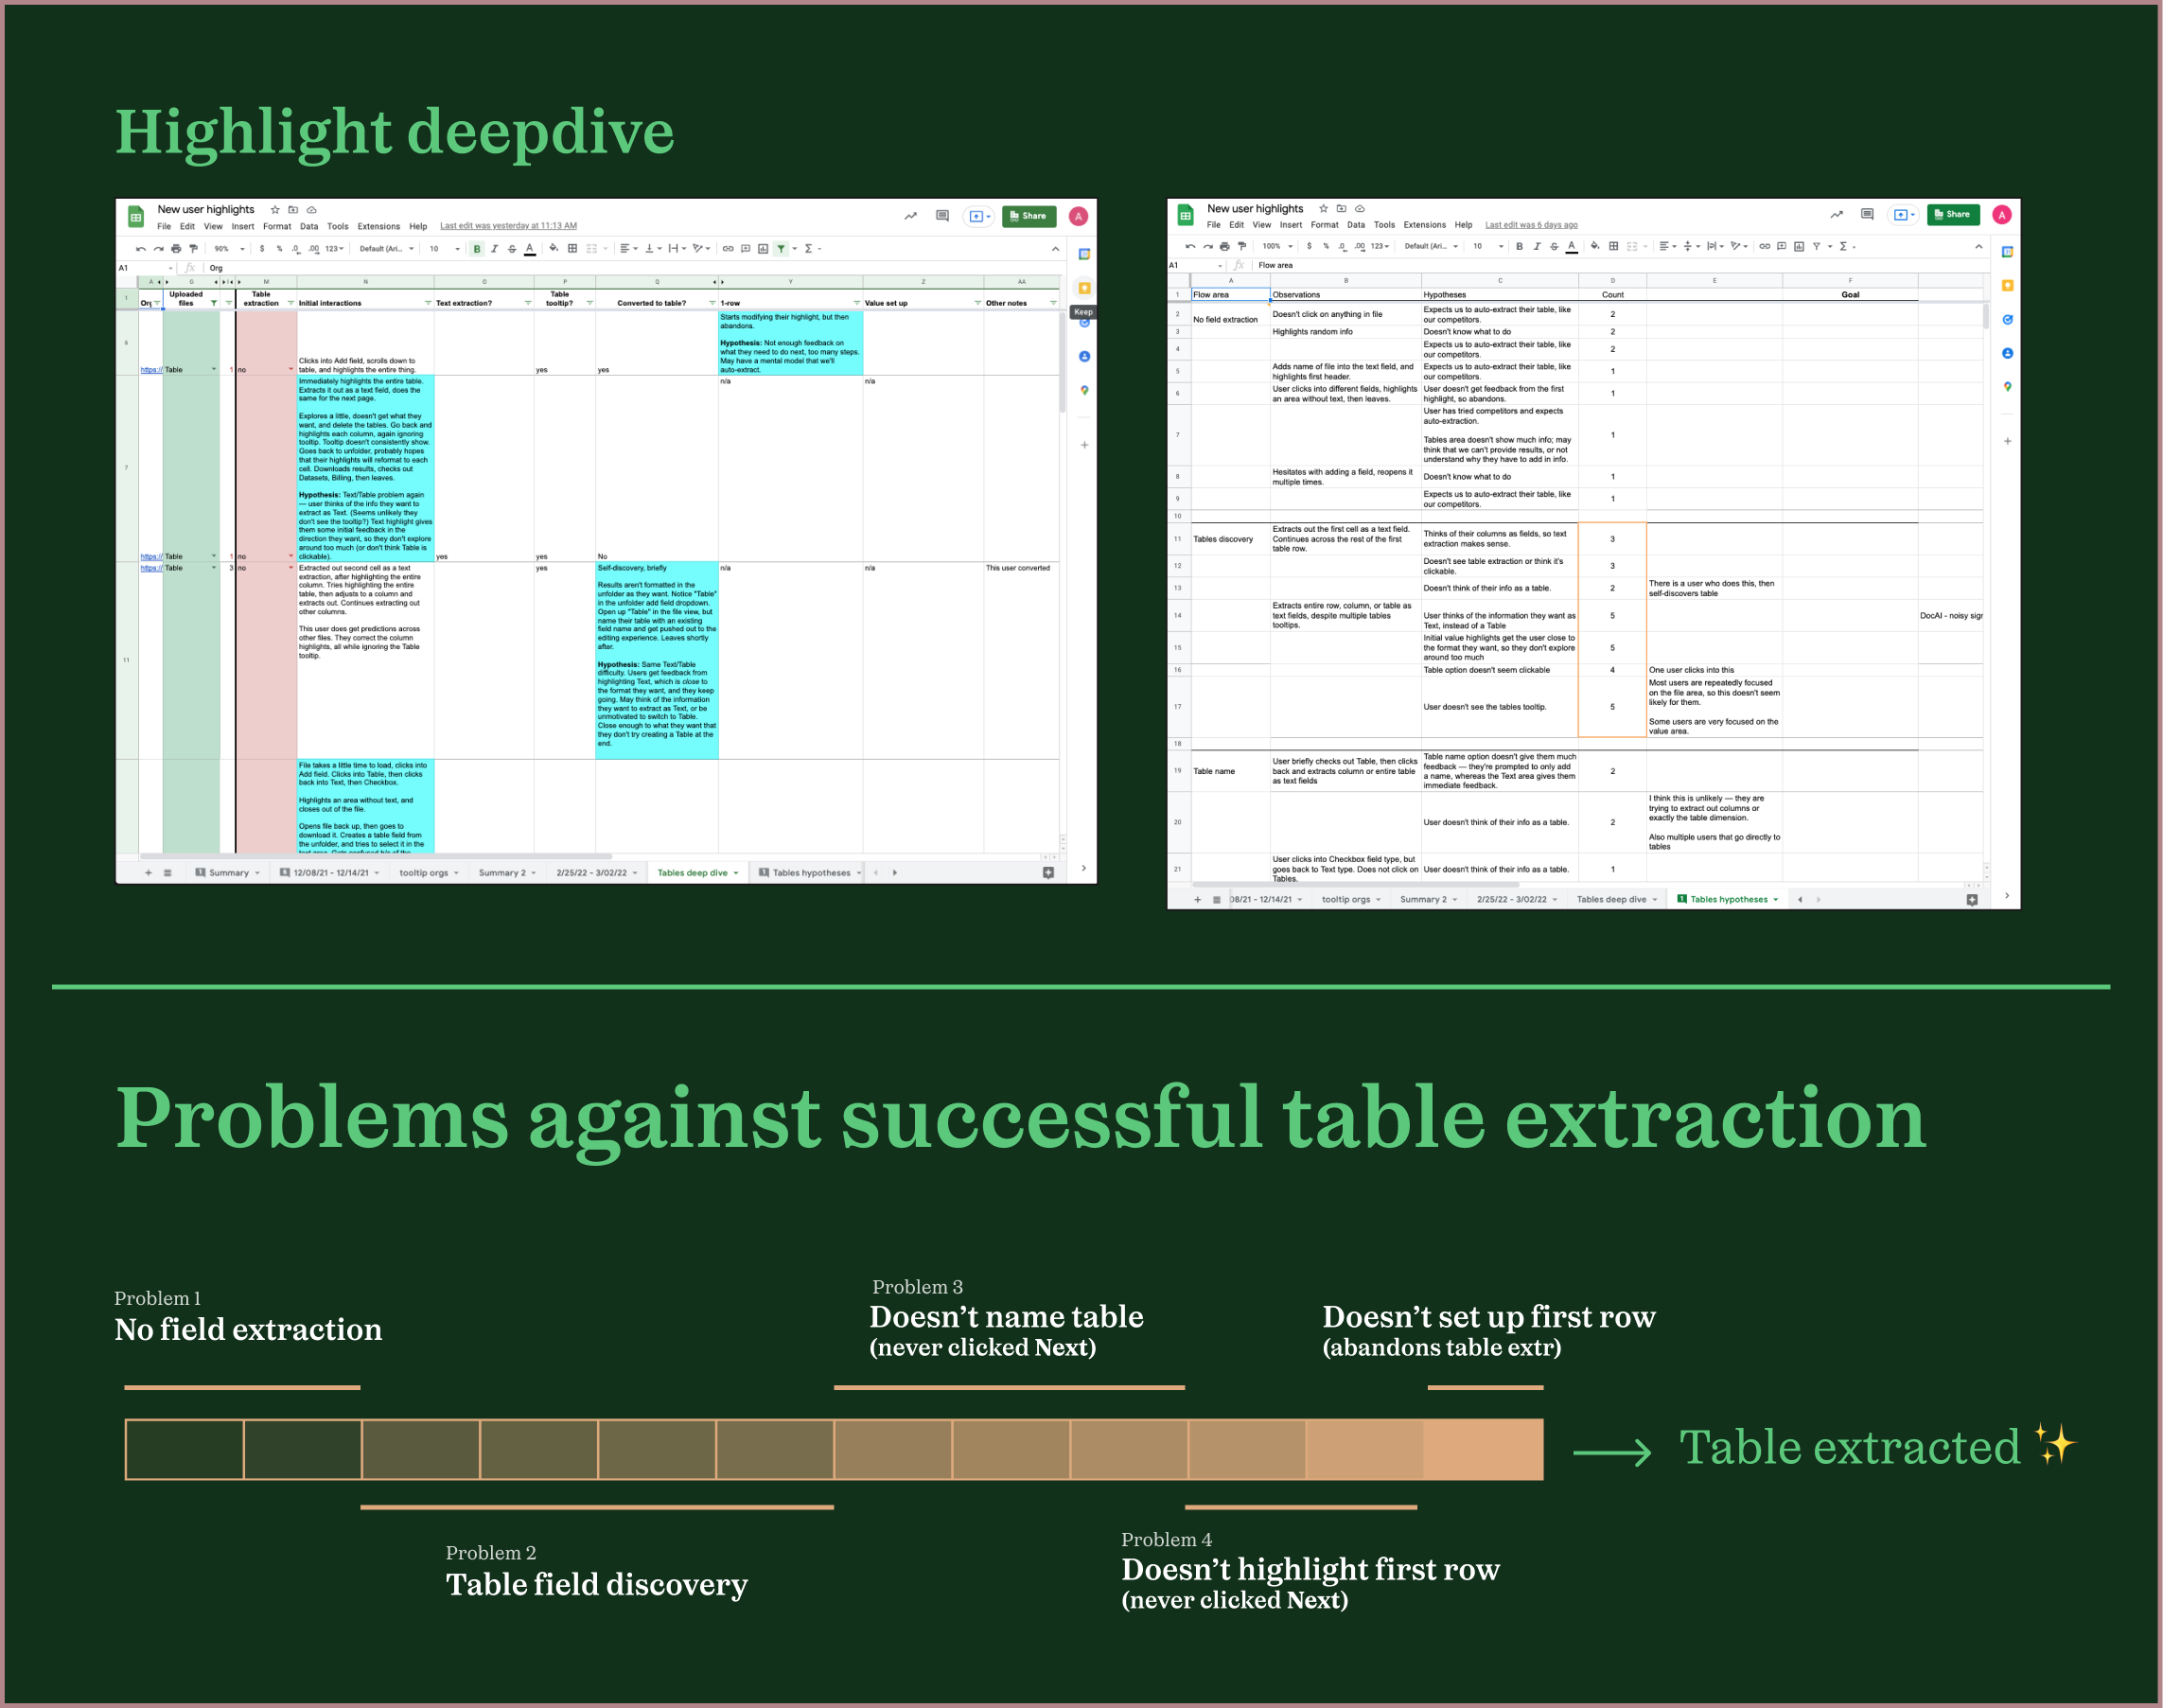
Although we had some users creating successful table extractions, since the configuration process required many initial and manual set up steps (unlike competitors), most users did not. Some users took a while to figure out the extraction type they should create, some users were still not labeling the correct first row, and others started labeling their table correctly but stopped mid-way through.
I saw a few ways to make the process more visual, and also partnered with a front-end developer to revisit where we could automate the set up process further now that the feature was further along.
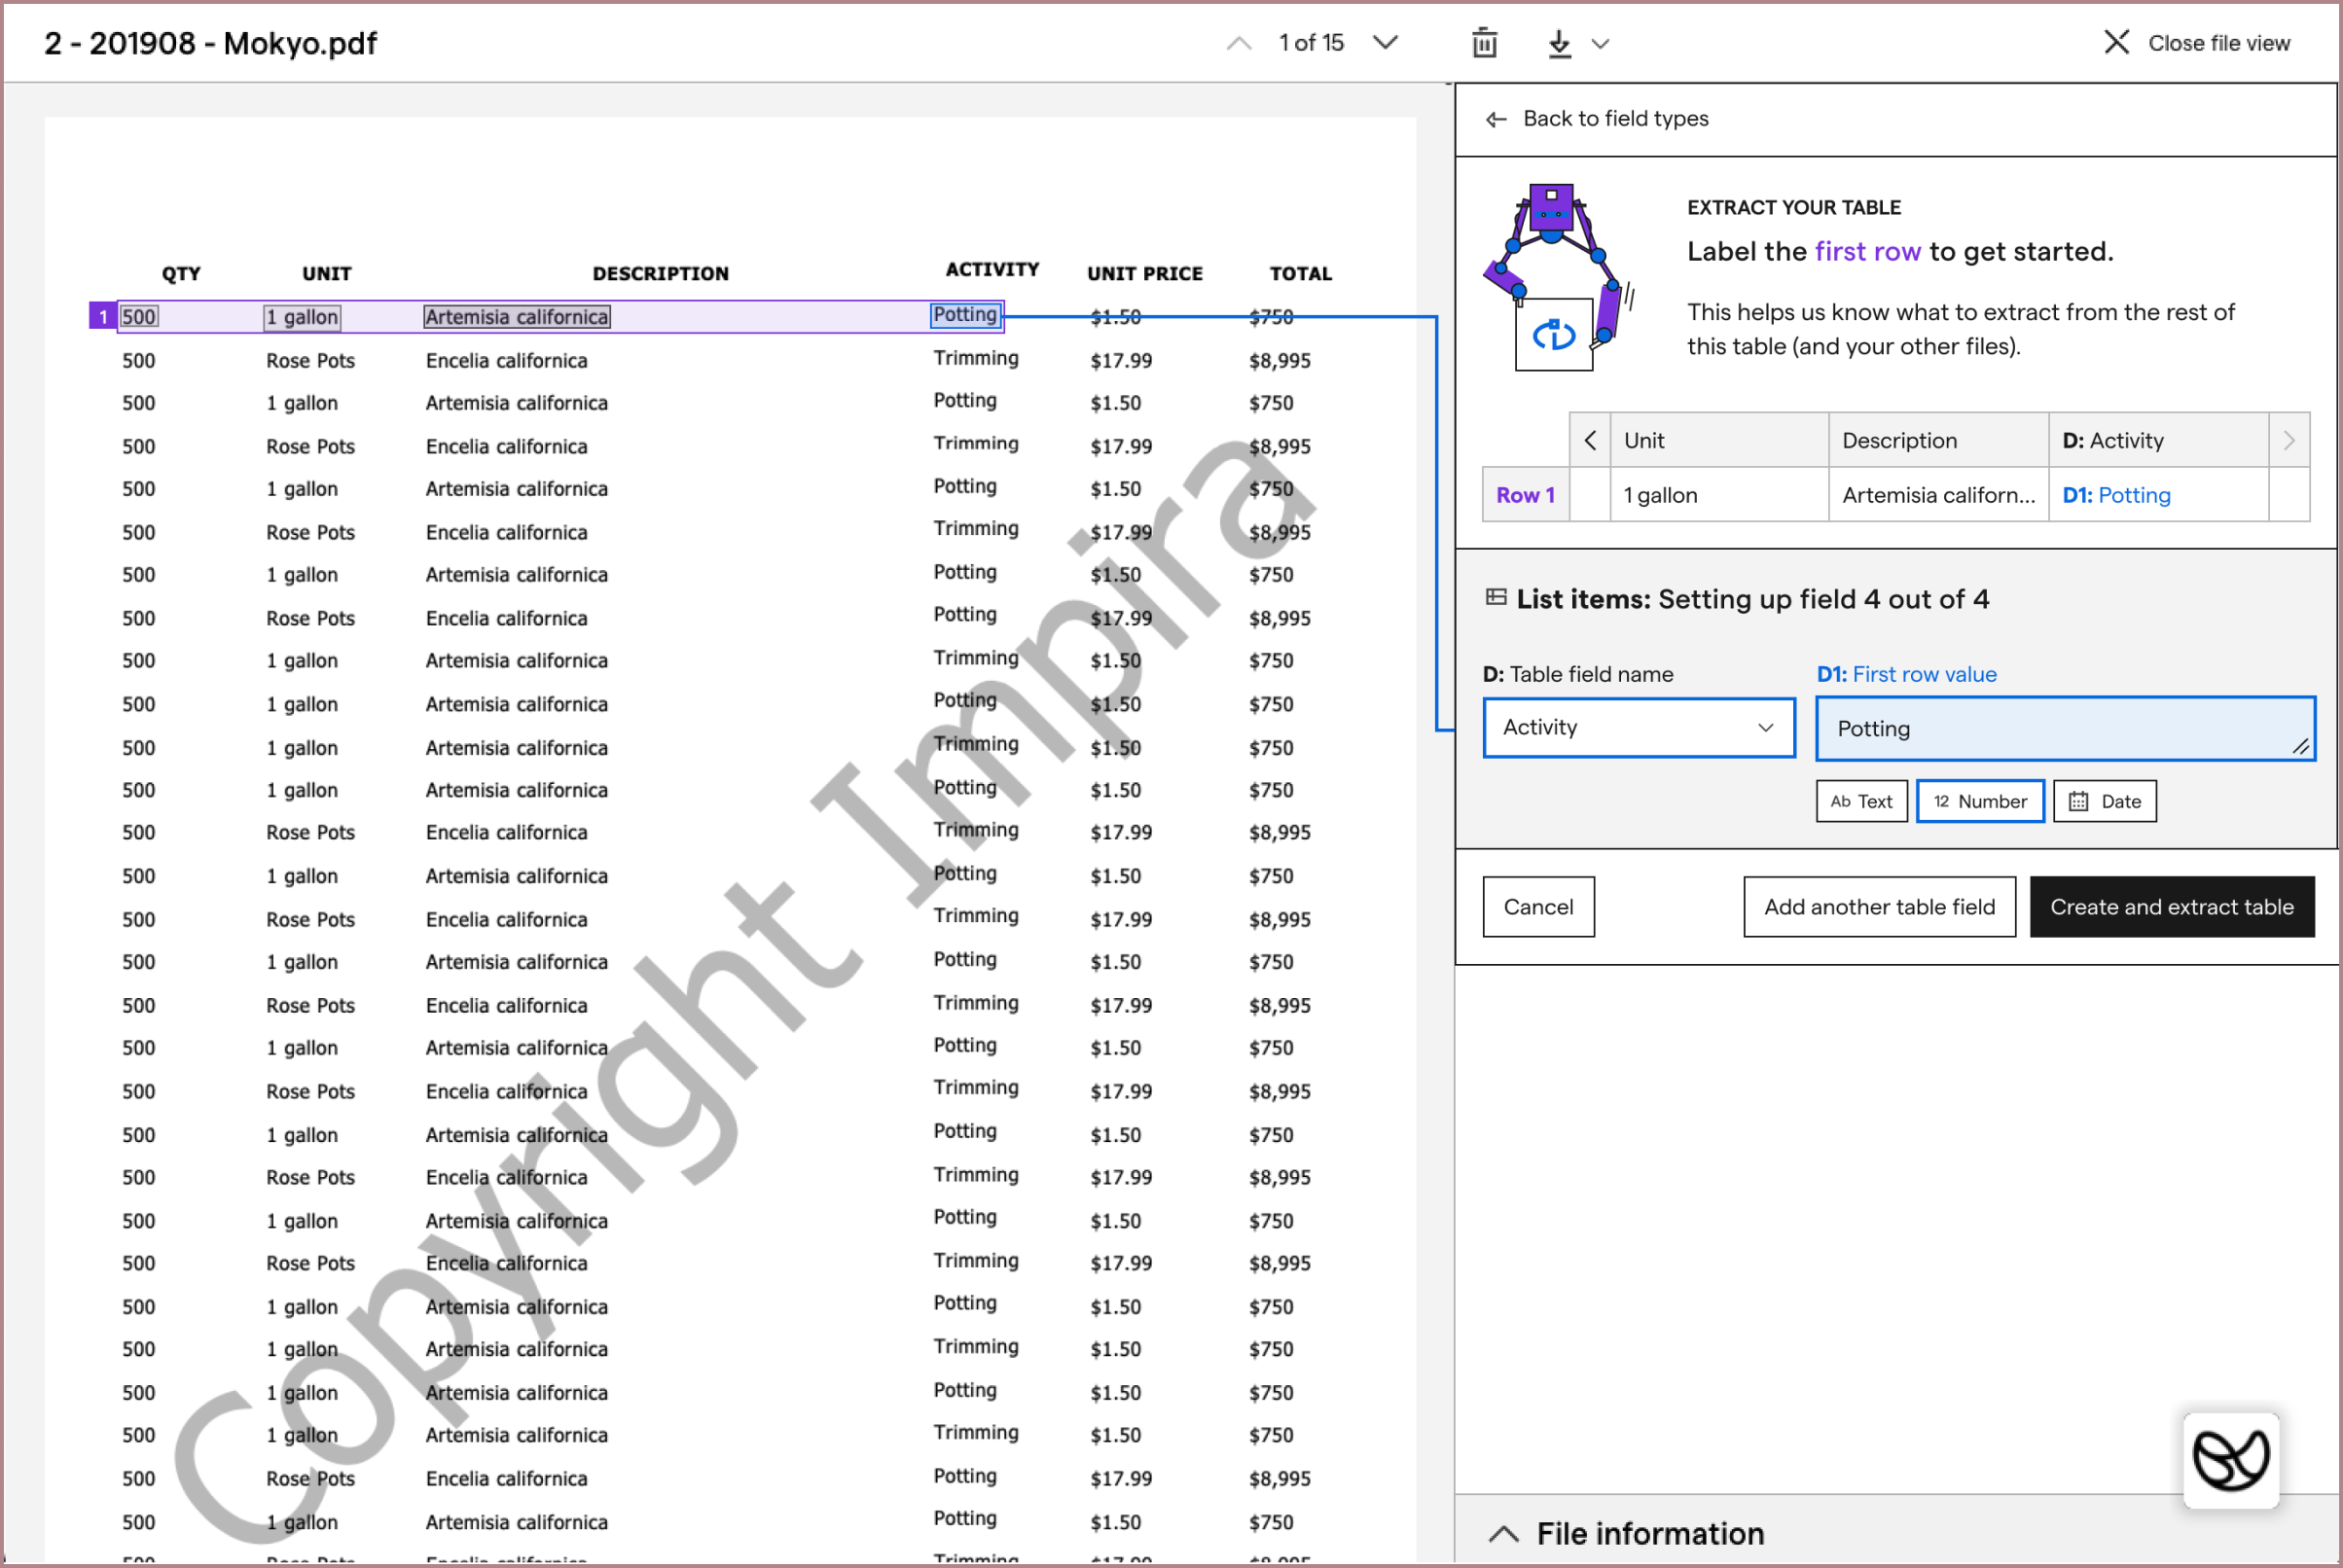
One of the first explorations I prototyped and tested was a visual way to communicate how users needed to set up each field type. When a user hovered over the table extraction image, they saw the first row of the table being highlighted in blue rectangles, a hint of what they would later have to do, and then the fields below highlighted by green.
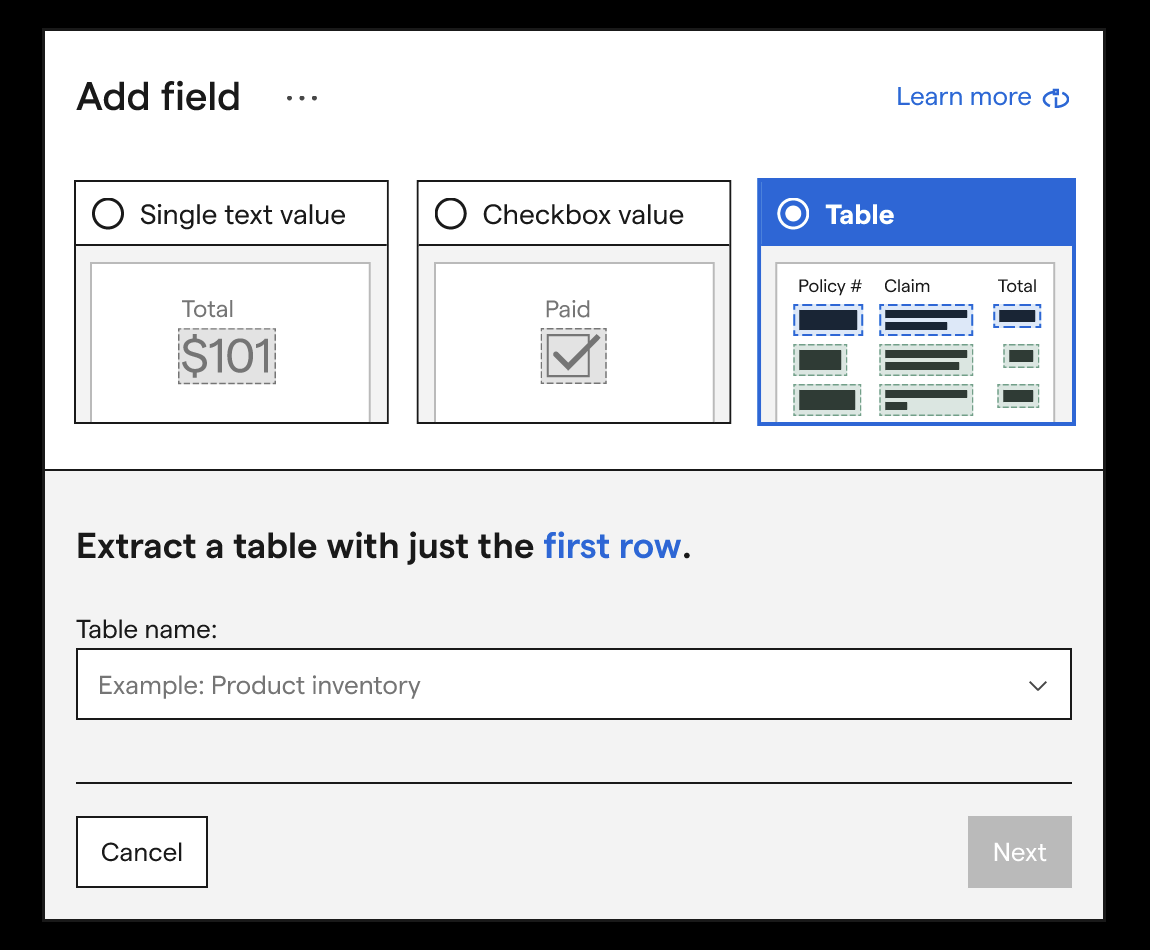
While a simple add, after we shipped this improvement, users stopped getting confused with which extraction type they should set up. We also saw more users start labeling their tables correctly.
From there, working with the rest of my product team, I started exploring designs to see if we could automatically identify users' tables' first rows, to make the configuration process easier.
To reduce the amount of work we needed to do to test this idea, we decided to first rely on an external API to detect the tables. If it worked well, we'd start developing that ability in-house. To see if the API could identify users' tables' first rows well, I performed an audit using a month’s worth of different simple and complex tables. Although the API we used could detect tables well most of the time, I found some table patterns in which it could not:
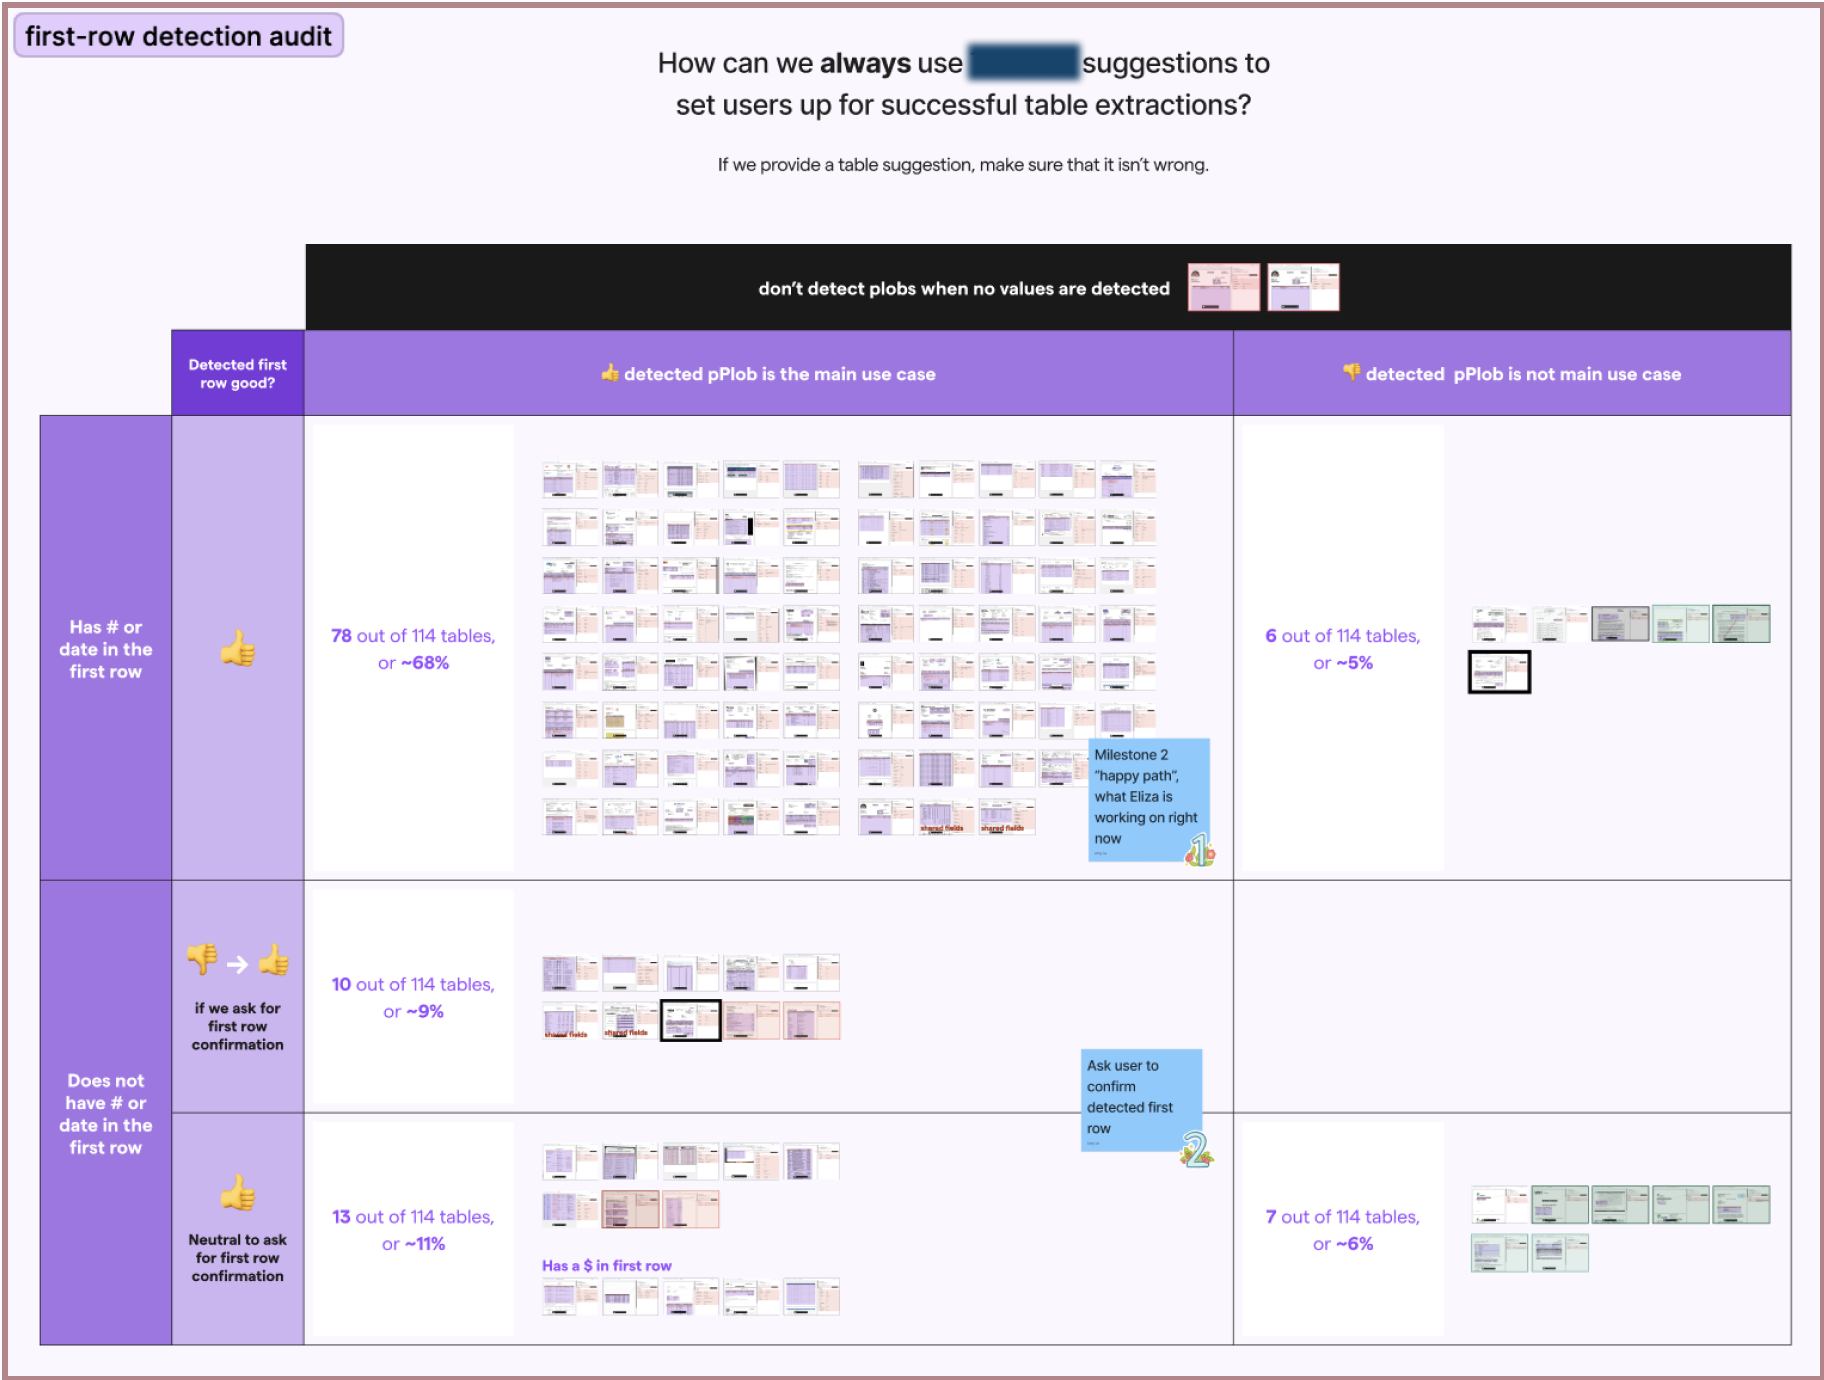
In these cases, I was able to manually identify heuristics for when a first-row would be badly detected, or not at all. I designed flows around each of these cases: first-row was well detected (~75% of audited tables), first-row was not well detected (~24% of audited tables), and no first-row was detected at all (remaining 1% of audited tables).
Although automatic first-row detection made the table configuration process much easier for most users, it appeared that 1 out of 4 users would still have to completely configure their tables manually. I wanted to see if we could make the process less manual for all of our users, and from collaborating closely with engineers on my team, I thought we could.
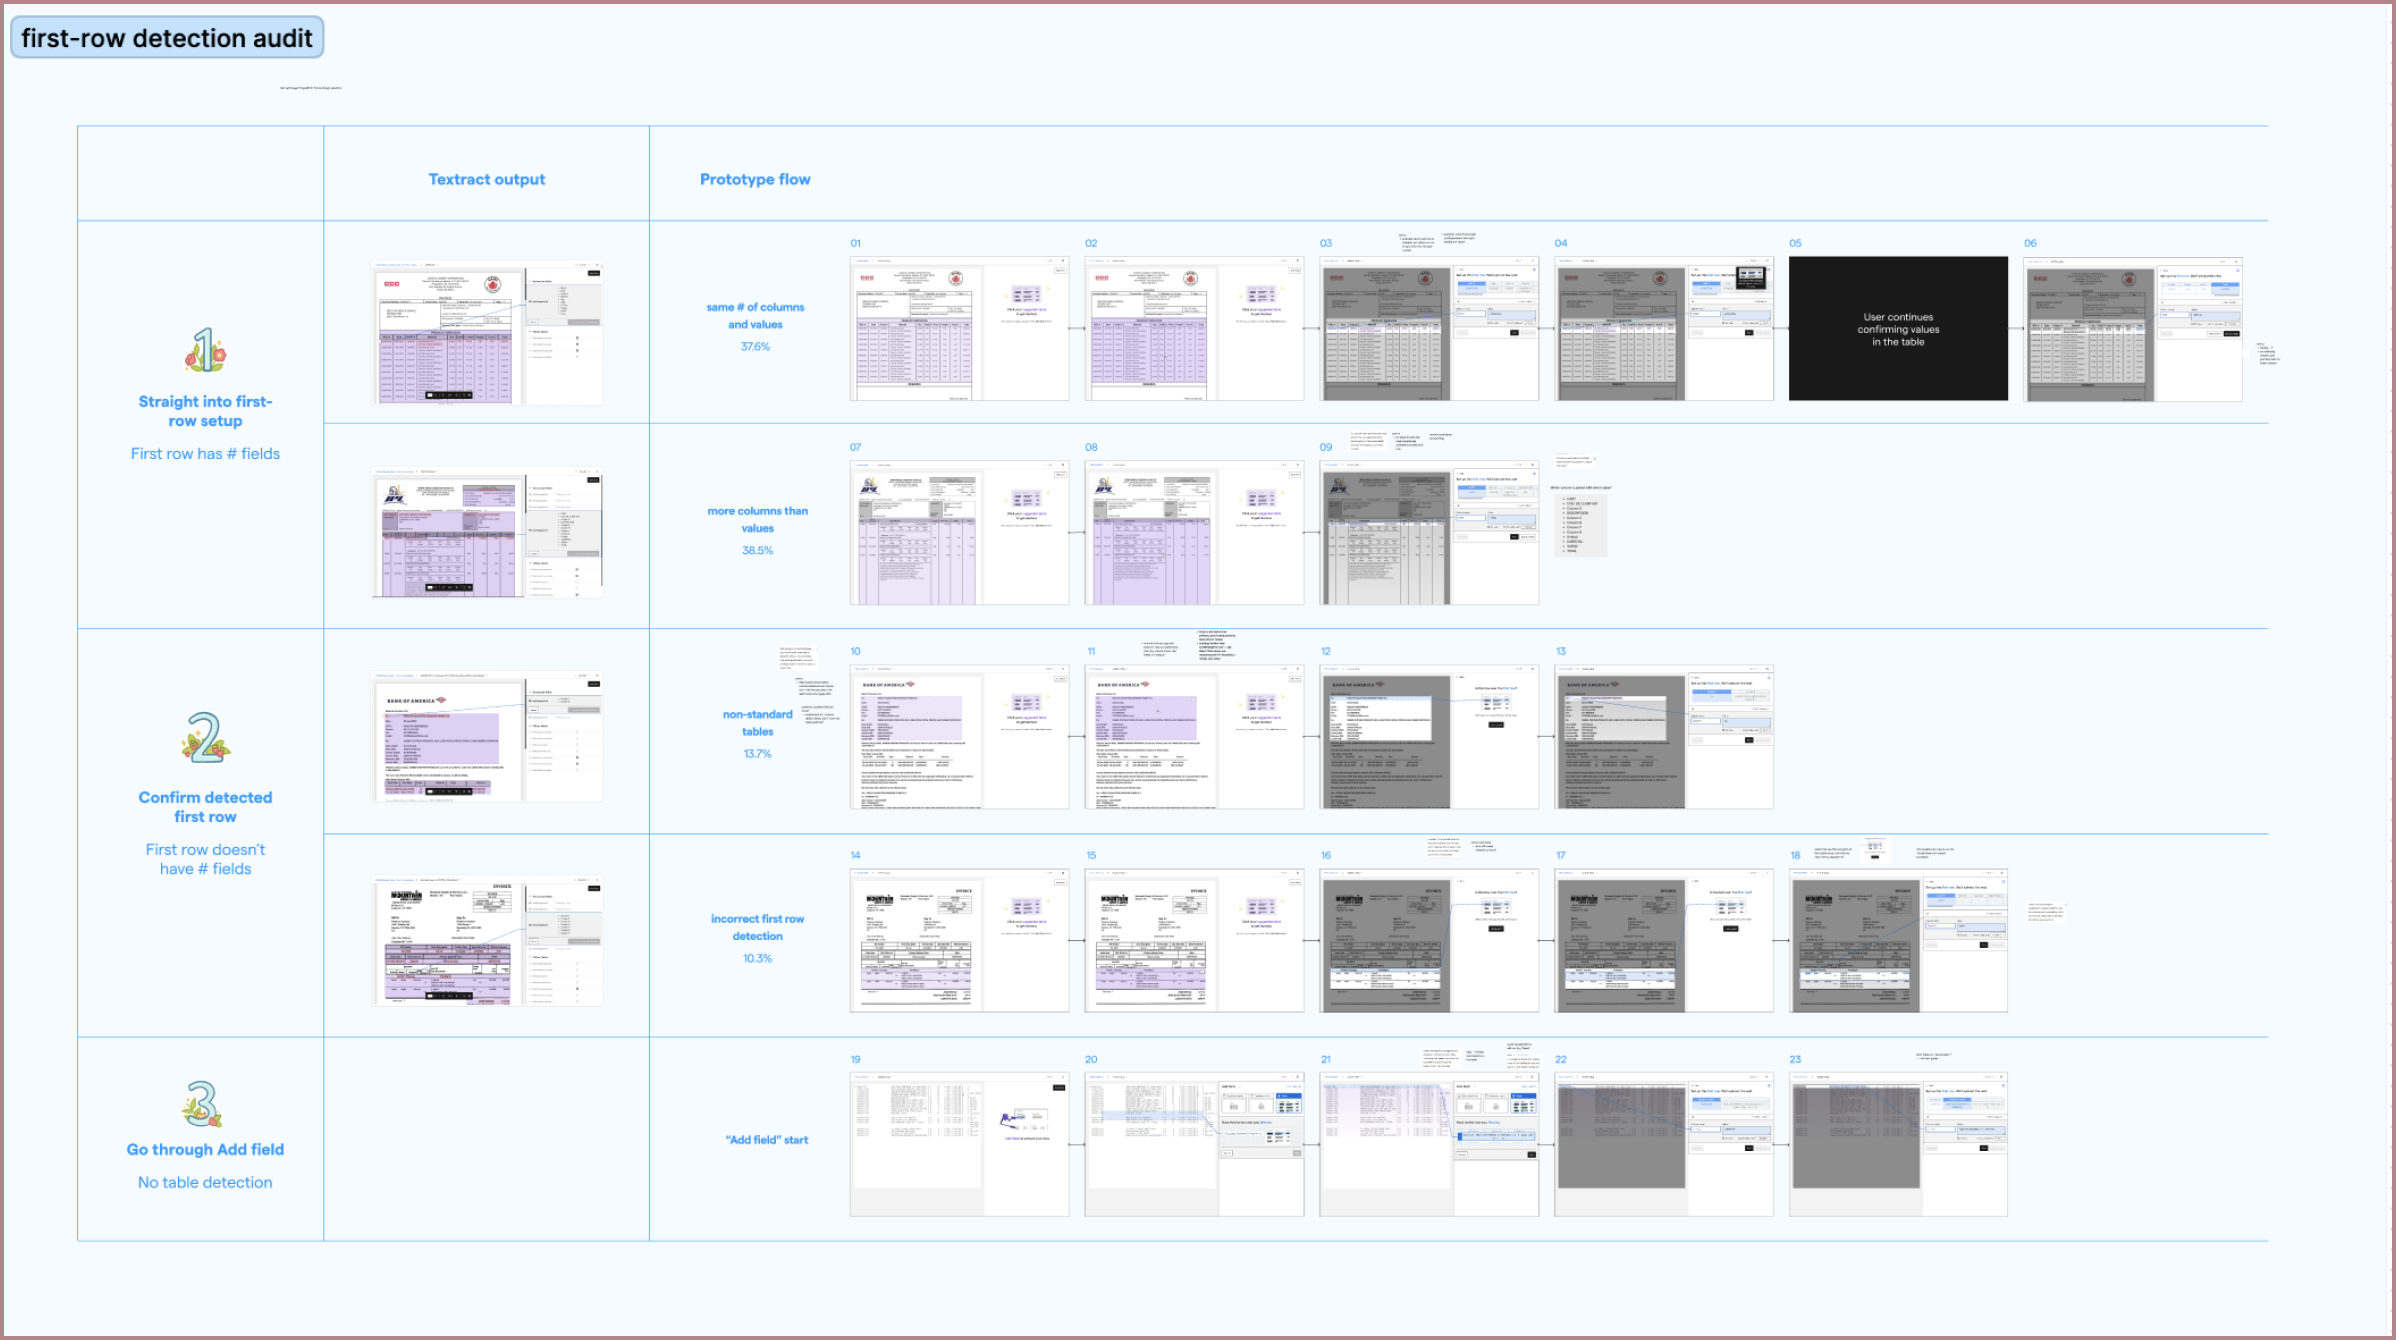
Along with a front-end developer, I revisited my very first “1-row detection” idea to see if we could fully detect and configure a table's first row. After a bit of iteration, we found that if the user selected their first row correctly, we could use the selection to very accurately identify all of the values inside of it.
With this improvement, all table extraction users would only have to draw a bounding box and confirm some fields before they saw accurate table predictions across multiple files. This matched the simplicity of our competitors' set up experiences but exceeding their extraction results.
Throughout each of these steps, I performed weekly to bi-weekly user tests, as before, and shared the results with the rest of my product team for ideation and feedback sessions. After seeing success in user tests, we A/B tested each improvement, and then released them into product.
After a few months of work, we had addressed all the major points of concern from our beta results, and the feature was a lot smoother. Our new flow looked like this:
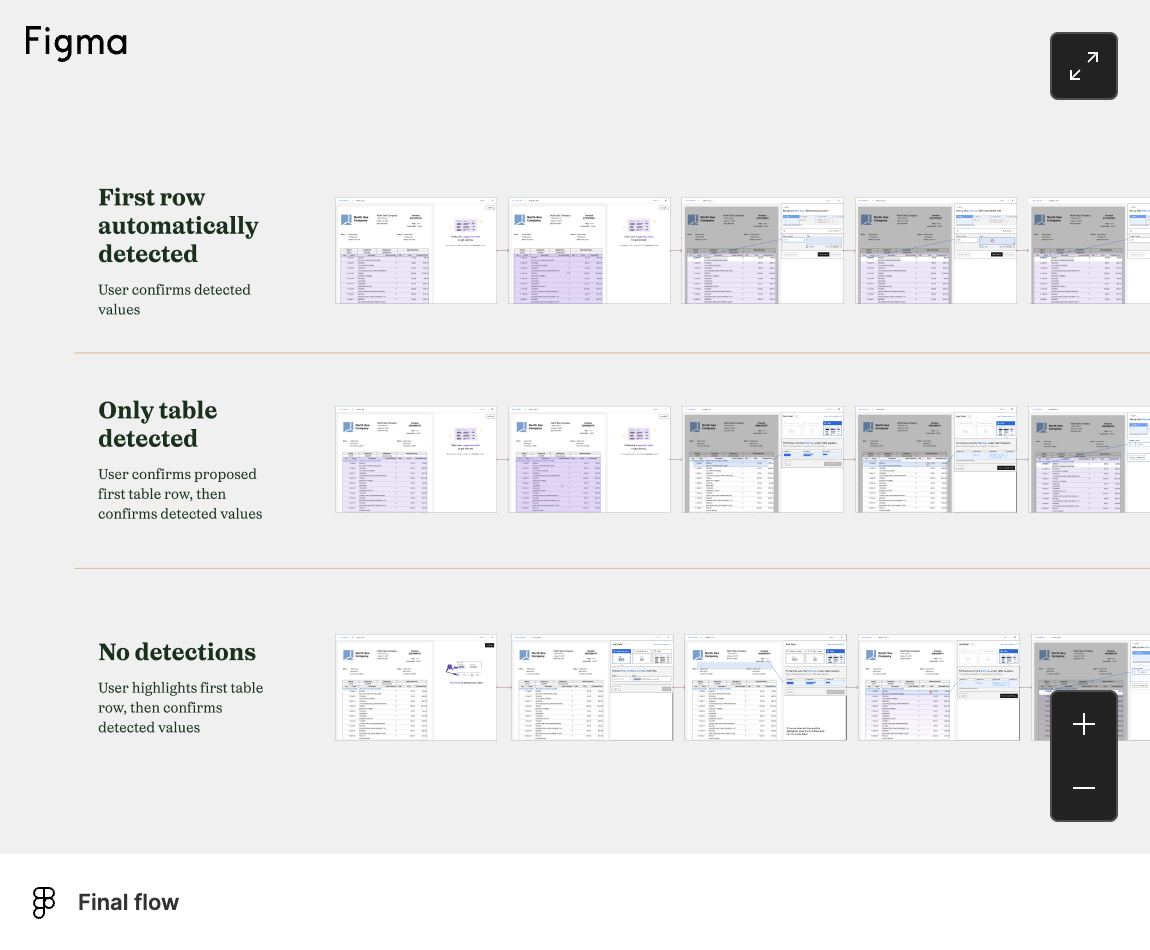
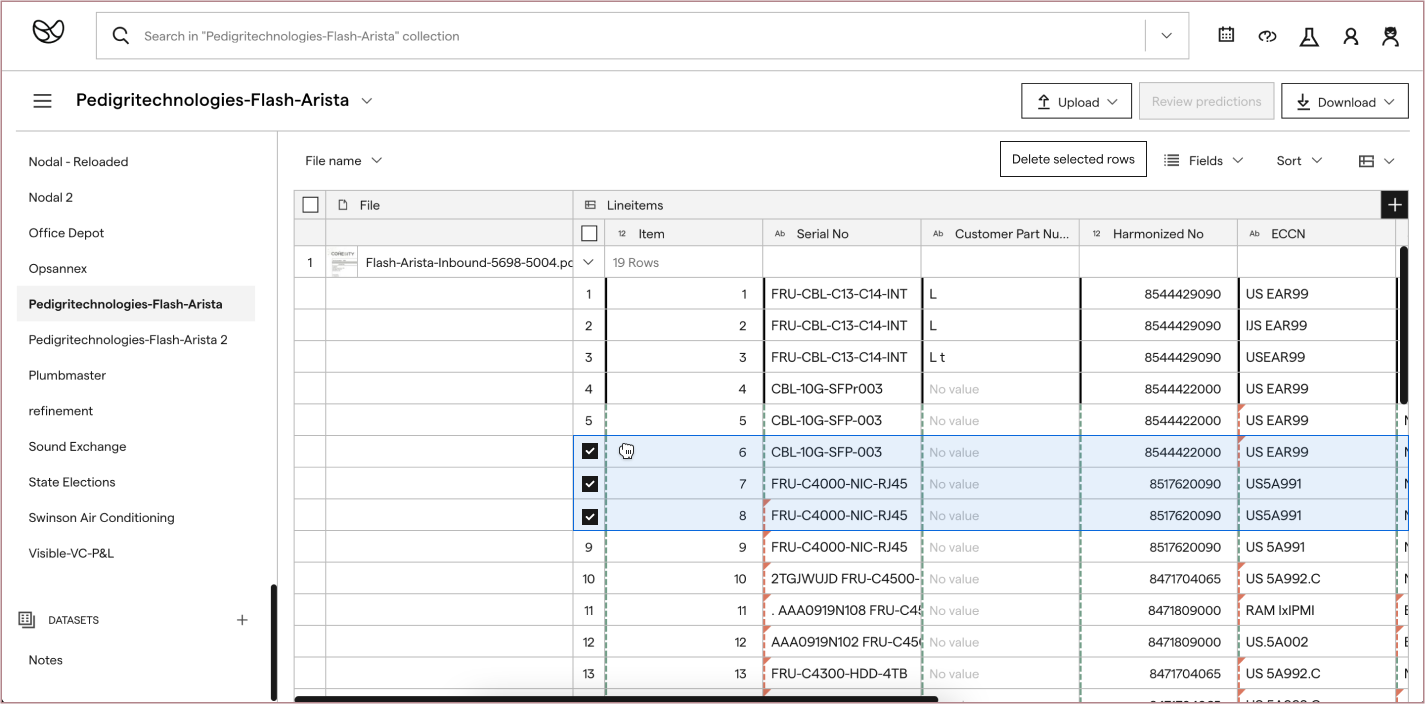
In addition to this, I also designed flows so users could quickly confirm their table predictions. If they confirmed or corrected other entire table rows, Impira would retrain its machine learning models and update its table predictions (another feature that competing solutions did not provide). The full flow helped users quickly create table extractions, view their results, and update results if needed—all without using any code themselves:
After all of these changes were implemented, the number of new table extractions increased to over 6 times from the beta results, and represented over half of the total extractions performed on Impira.